
Fig. 4
- ID
- ZDB-IMAGE-170111-4
- Publication
- Begay et al., 2016 - FLNC Gene Splice Mutations Cause Dilated Cardiomyopathy.
- All Figures
- Figures for Begay et al., 2016
|
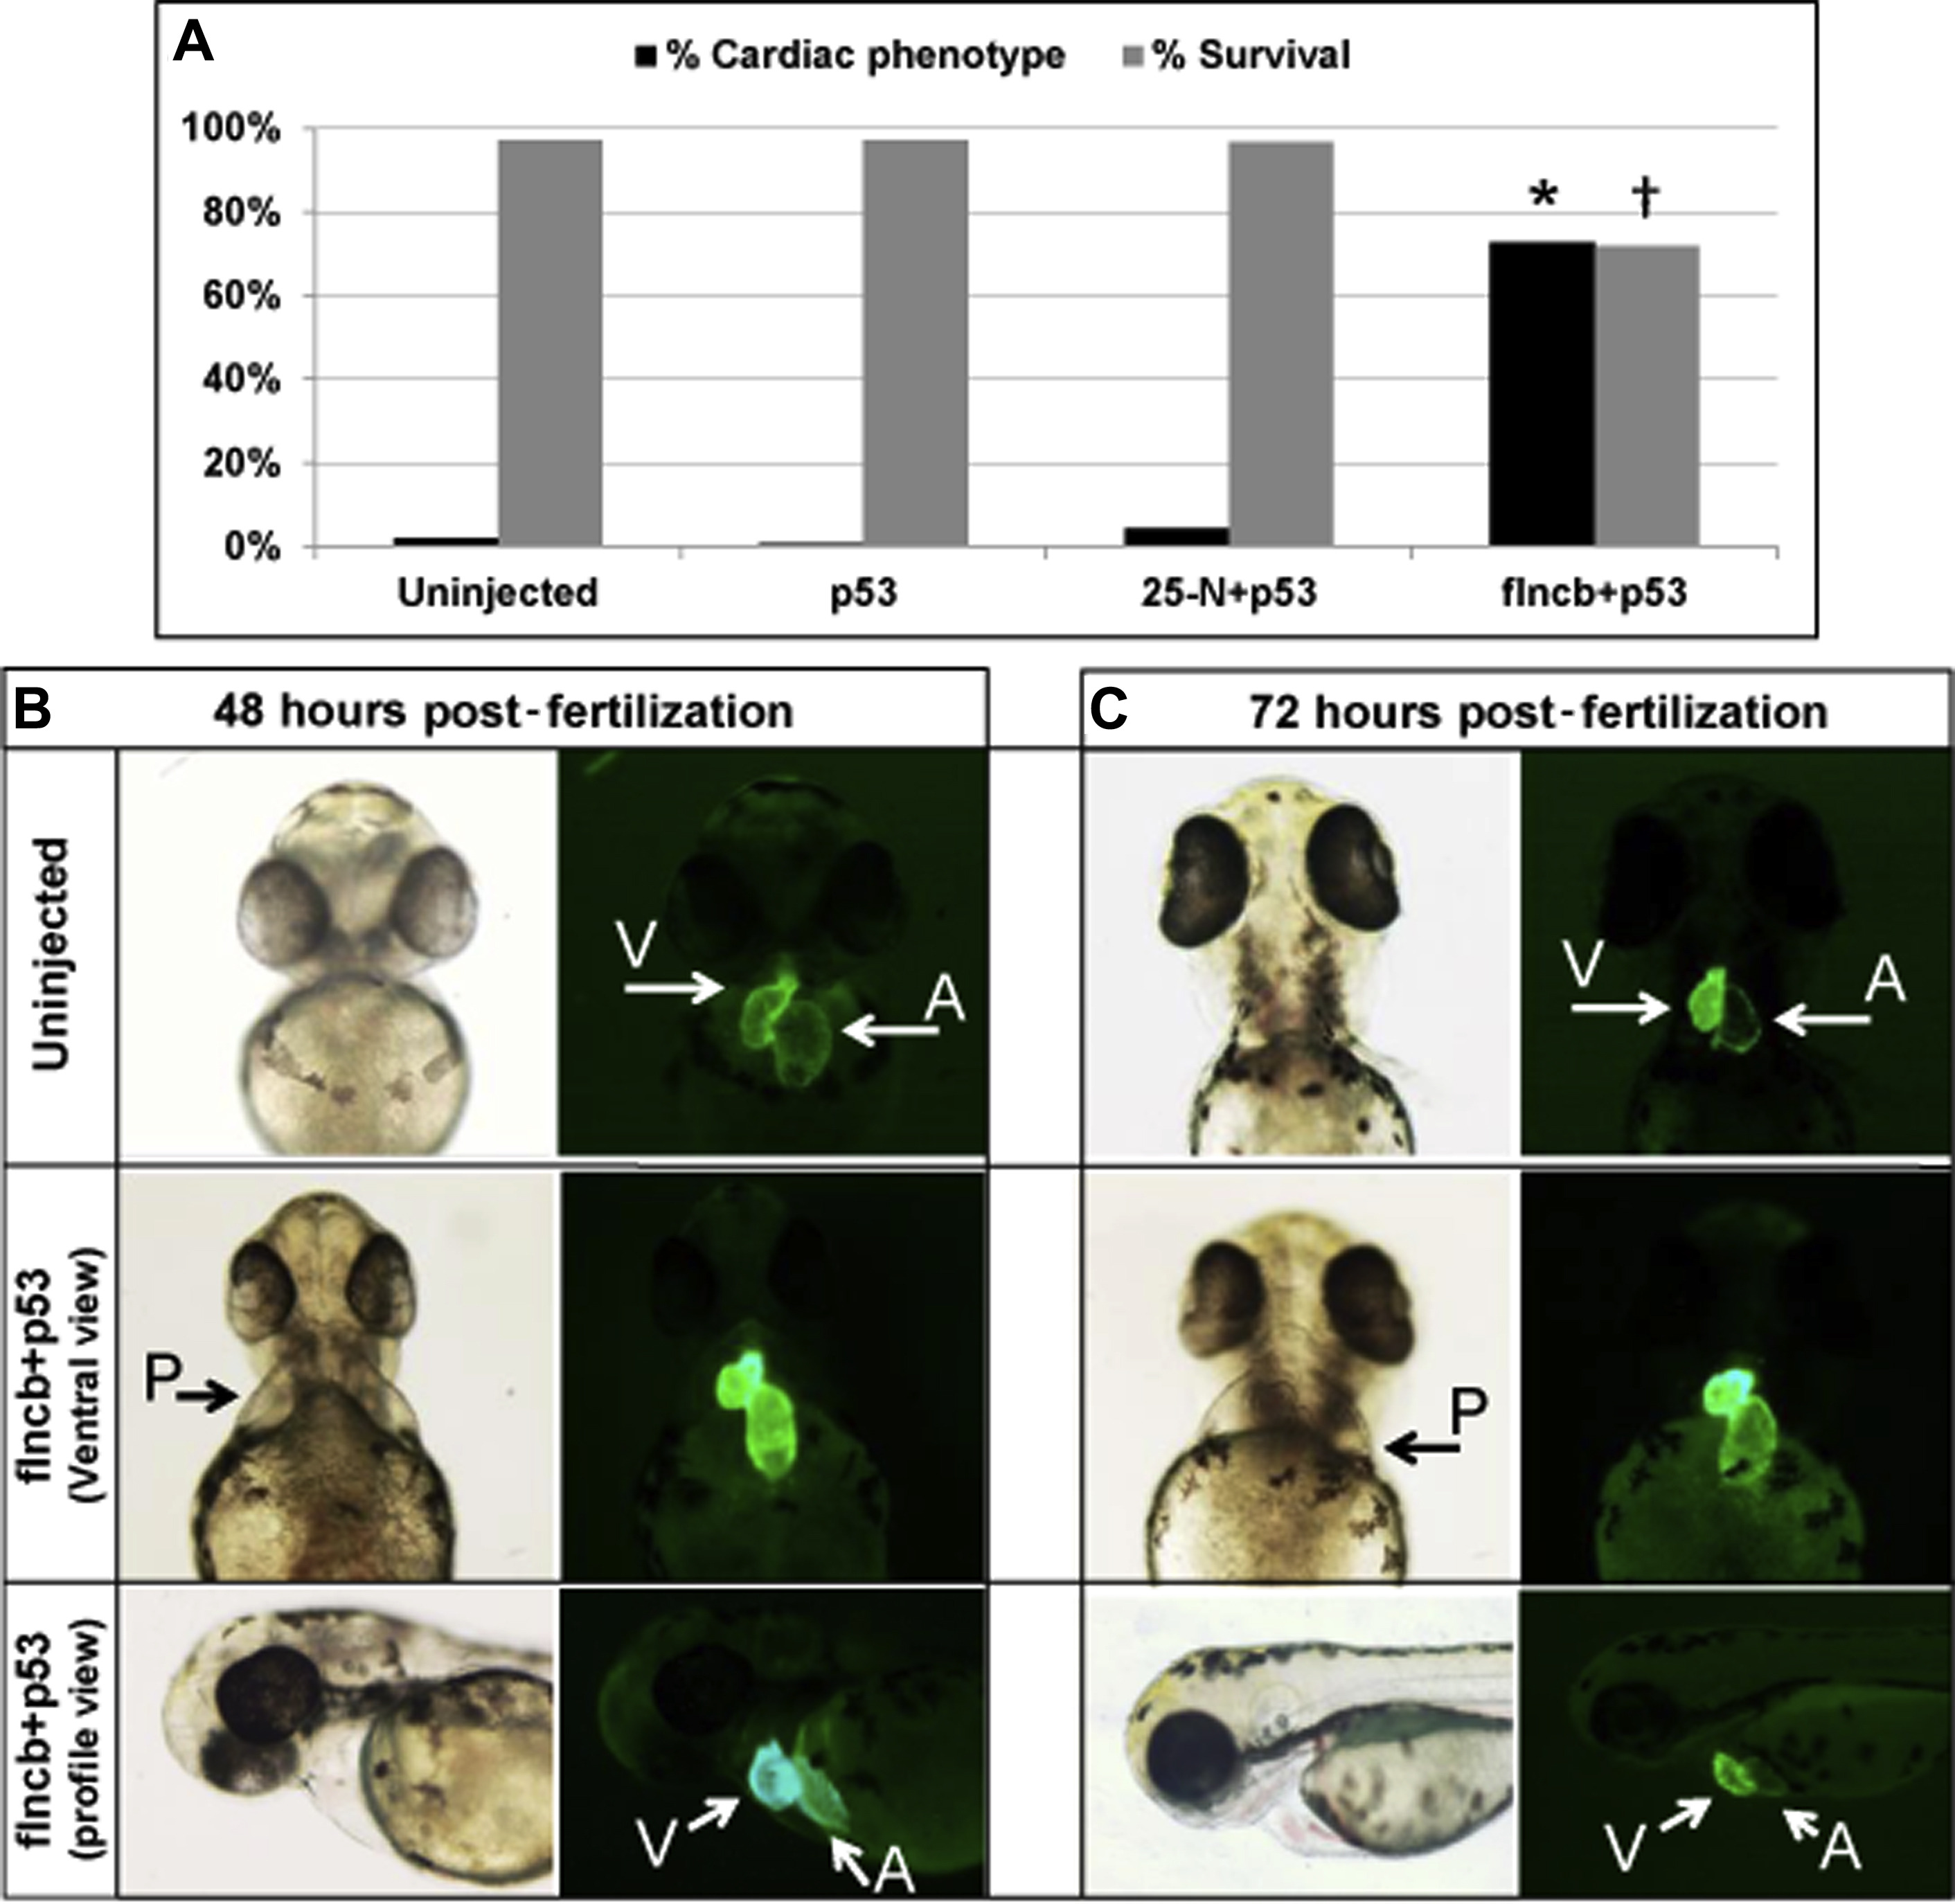
Fig. 4
MO Knockdown of flncb in Zebrafish Showing a Cardiac Phenotype
(A) Black bars: percentage of surviving embryos with severe cardiac phenotype at 72 h post-fertilization (hpf) for uninjected (n = 411), p53 morpholino (MO)-injected (n = 139), 25-N+p53 control MO-injected (n = 351), and filamin Cb (flncb)+p53 MO-injected (n = 241); *p = 1.04 × 10-83 (for comparison of uninjected heart vs. flncb+p53 MO using chi-square testing). Gray bars: percentage of surviving embryos at 7 days for uninjected (n = 411), p53 MO-injected (n = 139), 25-N+p53 control MO-injected (n = 351), and flncb+p53 MO-injected (n = 164); †p = 1.65 × 10⁻¹⁹ (for comparison of uninjected embryo vs. flncb+p53 MO using chi-square testing). (B) Representative zebrafish heart pictures for embryo uninjected and flncb MO coinjected with p53 MO zebrafish embryos at 48 hpf. The flncb+p53 MO-injected zebrafish show cardiac phenotype (pericardial edema [P]), and GFP hearts showing less heart looping, elongated atrium, pericardial edema, and a truncated ventricle. (C) Representative zebrafish heart pictures for embryo uninjected and flncb MO coinjected with p53 MO zebrafish embryos at 72 hpf. Among the flncb+p53 MO-injected zebrafish, they show cardiac phenotype, and GFP hearts further show less heart looping, elongated atrium, pericardial edema, and a truncated ventricle.