
IMAGE
Fig. 2
Image
|
Figure Caption
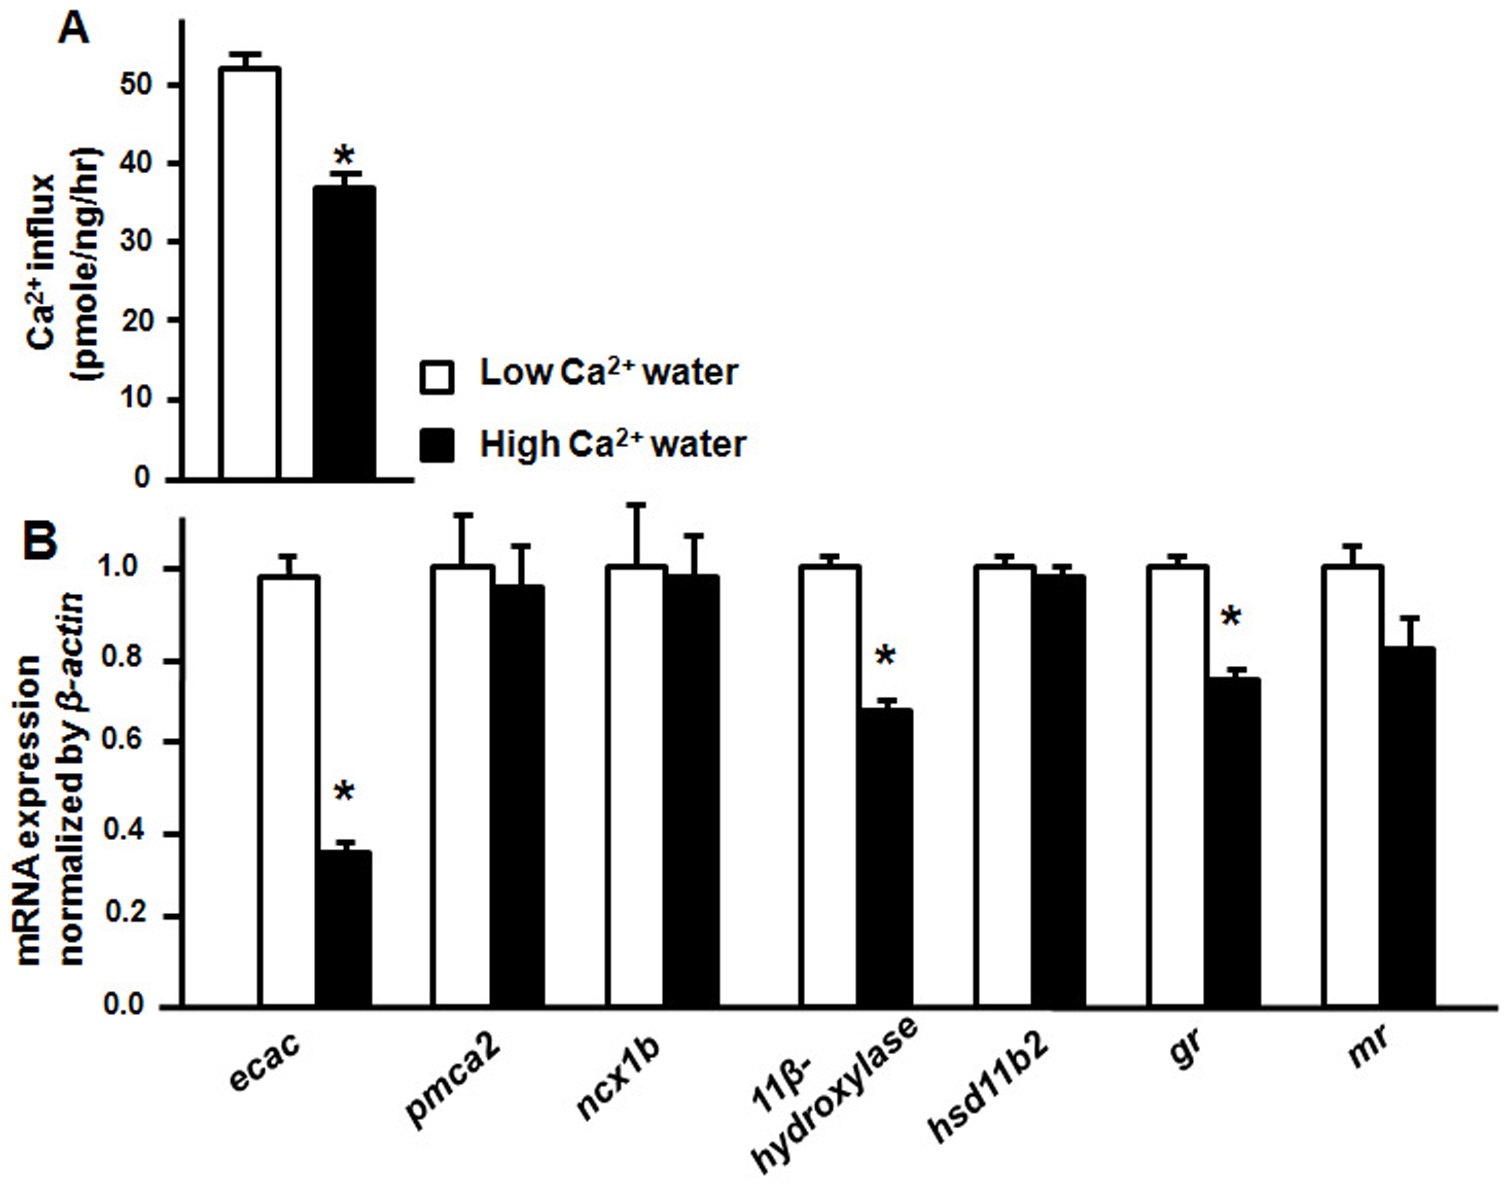
Fig. 2
Ca2+ influx and gene expressions of Ca2+ regulation-related genes.
Ca2+ influx (A) and mRNA expression (B) of 3-dpf zebrafish embryos acclimated to low- (0.02 mM Ca2+) or high-Ca2+ (2.00 mM Ca2+) artificial fresh water. mRNA expression analyzed by qPCR and values were normalized to β-actin. Values are the mean ± SEM (n = 4~6). *Significant difference (Student′s t-test, p<0.05).
Figure Data
Acknowledgments
This image is the copyrighted work of the attributed author or publisher, and
ZFIN has permission only to display this image to its users.
Additional permissions should be obtained from the applicable author or publisher of the image.
Full text @ PLoS One