
|
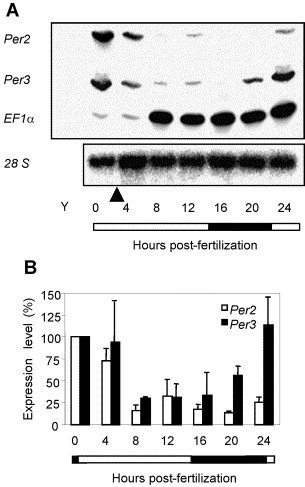
Fig. 2
Differential regulation of Per2 and Per3 expression during zebrafish early embryogenesis. (A) Embryos kept in a LD14:10 light/dark cycle were collected every 4 h from the time of fertilization until 24 hpf. Per2, Per3 and EF1α mRNA expression was analyzed by RNase protection assay. As expected, a strong induction of the elongation factor gene EF1α expression was observed after the midblastula transition which in zebrafish occurs at 3-4 hpf at 28°C (Gao et al., 1997). Yeast (Y) RNA was included as a negative control. 28S rRNA levels were determined by Northern blot analysis and used as control for loading. The arrow indicates the midblastula transition. Black and white bars indicate the dark and light phases, respectively (ZT, zeitgeber time). (B) Quantification of the RNase protection assay shown in (A). Each time point included a pool of 100-200 embryos and data were expressed relative to the time 0 level and represent mean±SD from three independent experiments.
Reprinted from Gene expression patterns : GEP, 3(3), Delaunay, F., Thisse, C., Thisse, B., and Laudet, V., Differential regulation of Period 2 and Period 3 expression during development of the zebrafish circadian clock, 319-324, Copyright (2003) with permission from Elsevier. Full text @ Gene Expr. Patterns