
|
Fig. 1
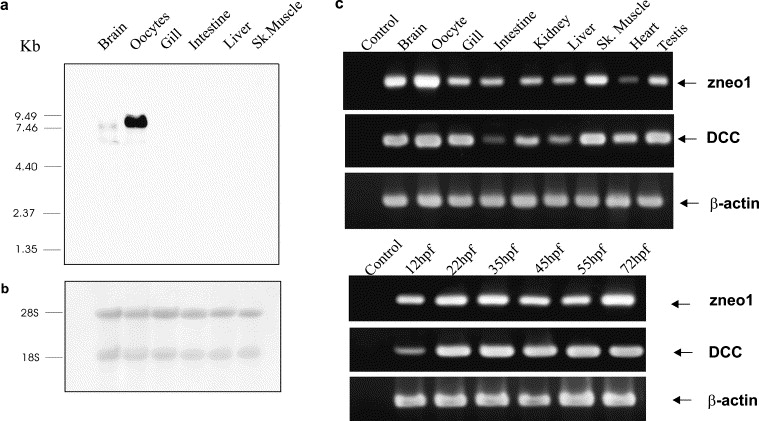
Expression of neogenin and DCC mRNAs in zebrafish. (a) Northern analysis of zneo1 transcripts in zebrafish tissues. Total RNA, 20 µg, from various tissues were fractionated on 1% denaturing agarose-formaldehyde gel and hybridized with a 1 kb 32P-labeled zneo1 probe according to standard protocols. Two zneo1 transcripts of 6.5 and 7.5 kb were detected only in brain and oocytes. The relative mobility of molecular weight marker is indicated on the left in kb. (b) Methylene blue staining of 18 and 28 s rRNAs revealed the integrity and comparable amount of total RNA used in (a). (c) Semiquantitative RT-PCR analysis for zneo1 and DCC mRNA expression in adult and embryonic zebrafish. RT-PCRs were performed with gene-specific primers. No-RT (data not shown) and no-template controls were involved in all the reactions giving no non-specific product. β-actin RT-PCR was used to standardize the reactions. hpf, hours post-fertilization.
Reprinted from Mechanisms of Development, 118(1-2), Shen, H., Illges, H., Reuter, A., and Stürmer, C., Cloning, expression, and alternative splicing of neogenin1 in zebrafish, 219-223, Copyright (2002) with permission from Elsevier. Full text @ Mech. Dev.