
|
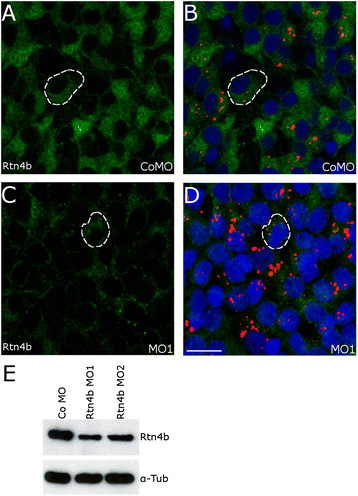
Fig. 4
Downregulation of Rtn4b in RGCs by MO1. After application of the control (Co) MO to the lesioned optic nerve, Rtn4b labeling of RGCs in retina whole mounts was intense at 5 days after ONS (A,B), but was markedly reduced when MO1 against Rtn4b (C,D) was offered. (B,D) The Rtn4b AB-labeled cells contain Lissamine (red) conjugated to the MOs. Examples of RGCs are outlined (white interrupted lines). DAPI stains the nuclei. Scale bar, 10 µm. (E) Western blot analysis showing a significant decrease in Rtn4b expression in retinae 5 days after ONS and application of MO1 and MO2 (P < 0.0001), respectively, to the optic nerve. Alpha-tubulin served as loading control.