
Fig. 1
|
Fig. 1
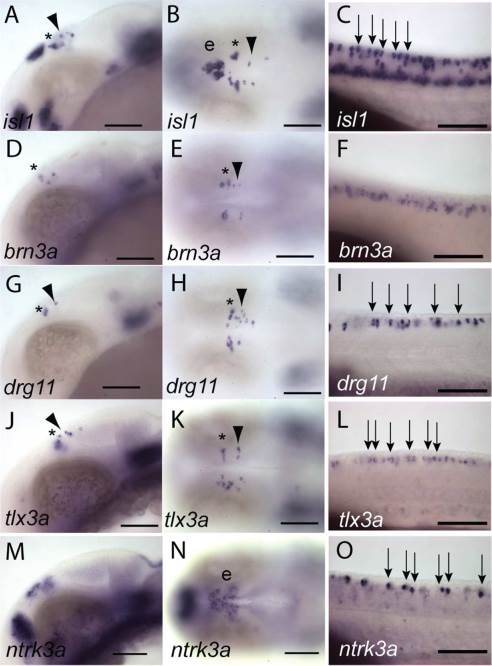
Heterogeneity of transcription factor gene expression in primary neuronal populations of the central nervous system. The expression of isl1 (A–C), brn3a (D-F), drg11 (G–I), tlx3a (J–L), and ntrk3a (trkc1, M–O) was analysed in 24-hpf embryos by in situ hybridisation. Expression of isl1, brn3a, drg11, and tlx3a was observed in MTN neurons (arrowheads), or nTPC neurons (asterisk) as well as RB neurons (arrows). In contrast, brn3a was observed in few MTN and nTPC neurons and was not observed in RB neurons, but instead was restricted to neurons at more ventral neural tube positions (D–F). We did not detect any expression of ntrk3a in nTPC or MTN neurons although we observed expression in epiphyseal neurons (e) and cells of the posterior diencephalon (M-N). In contrast, ntrk3a was expressed in a sub-population of RB neurons relative to isl1 expression (O).