IMAGE
Fig. 5
Image
Figure Caption
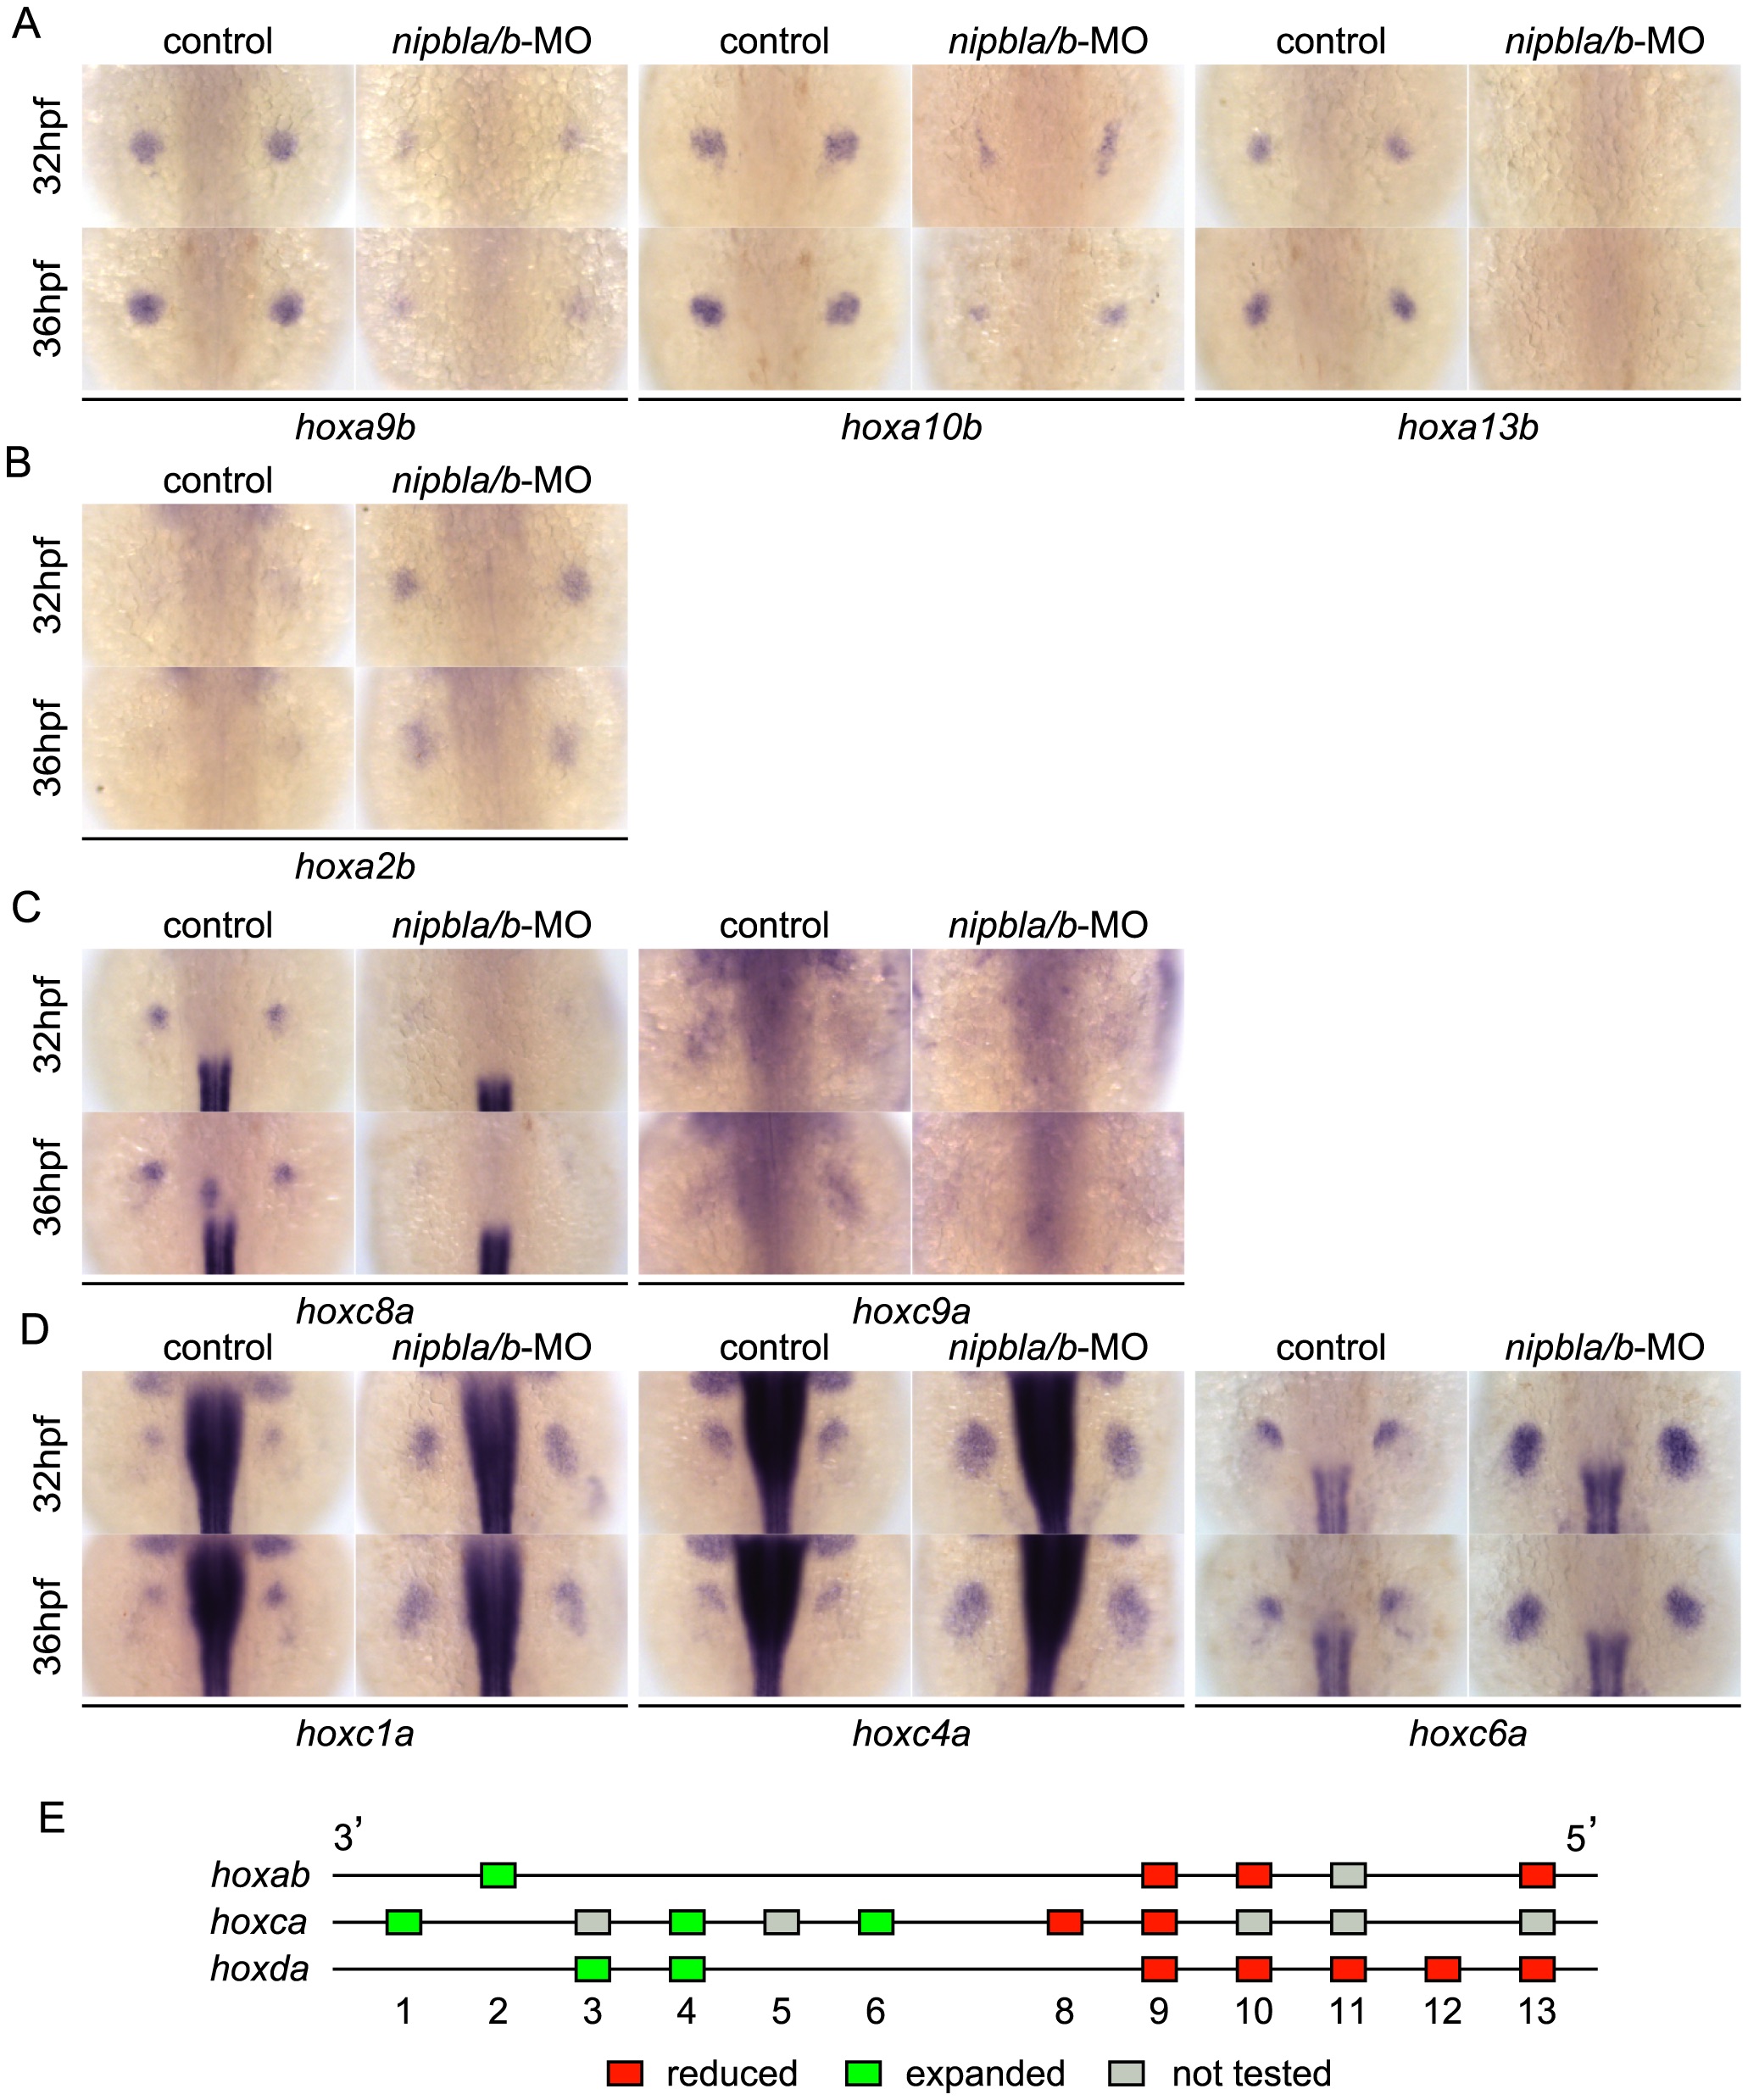
Fig. 5 Nipbls regulate hox gene expression according to genomic location.
(A–D) Expression of genes in hoxab (A,B) and hoxca (C,D) clusters was examined by ISH. (A) 5′-hoxa, (B) 3′-hoxa, (C) 5′-hoxc, and (D) 3′-hoxc genes. Dorsal views, anterior to the top. (E) Diagram summarizing effects of Nipbl reduction on hox genes. Genes located closer to 5′-ends show reduced expression (red boxes) whereas those closer to 3′-ends become expressed across entire fin buds (green boxes).
Figure Data
Acknowledgments
This image is the copyrighted work of the attributed author or publisher, and
ZFIN has permission only to display this image to its users.
Additional permissions should be obtained from the applicable author or publisher of the image.
Full text @ PLoS Genet.

