
Fig. 4
|
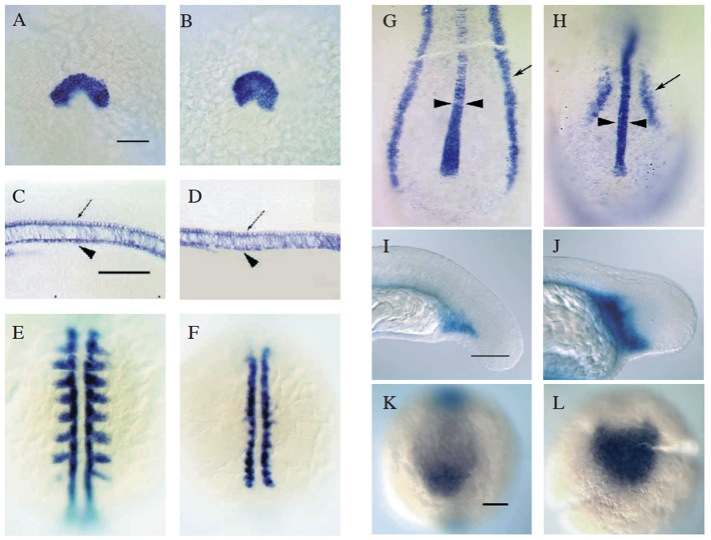
Fig. 4 Differential response of mesodermal derivatives to loss of cerebum activity. (A,B) Expression of hgg-1 at the 4-6 somite stage in (A) WT and (B) crm mutant in presumptive hatching gland cells. (C,D) Expression of col2a1 in the trunk of WT (C) and mutant (D) [24 hours]. In addition to the notochord, col2a1 is expressed in the floor plate (arrows) overlying the notochord, and the hypochord (arrowheads), a row of endodermal cells beneath the notochord. (E,F) myoD expression [8 somite stage] in WT (E) and mutant (F). At least a subset of the myoD-expressing adaxial cells (Weinberg et al., 1996) are present in the mutant, consistent with the later development of muscle pioneers (S. Fisher, unpubl. obs.). (G,H) The width of the axial domain of lim1 expression (arrowheads) in the developing notochord is similar in WT (G) and mutant (H), while expression in the developing pronephric ducts (arrows) is greatly decreased in the mutant [8 somite stage]. (I,J) The expanded pool of blood precursor cells in the crm mutant (J) compared to WT (I) is revealed by expression of gata2 [20 somite stage]. (K,L) Ventral tail bud expression of eve1 [8 somite stage] is also expanded in the mutant (L) compared to WT (K). A,B and E-H are dorsal views, with anterior to the top. C,D,I and J are side views with anterior to the left. K and L are posterior views, with dorsal to the top. Scale bars = 100 mm; E-H and L are the same magnification as K.