
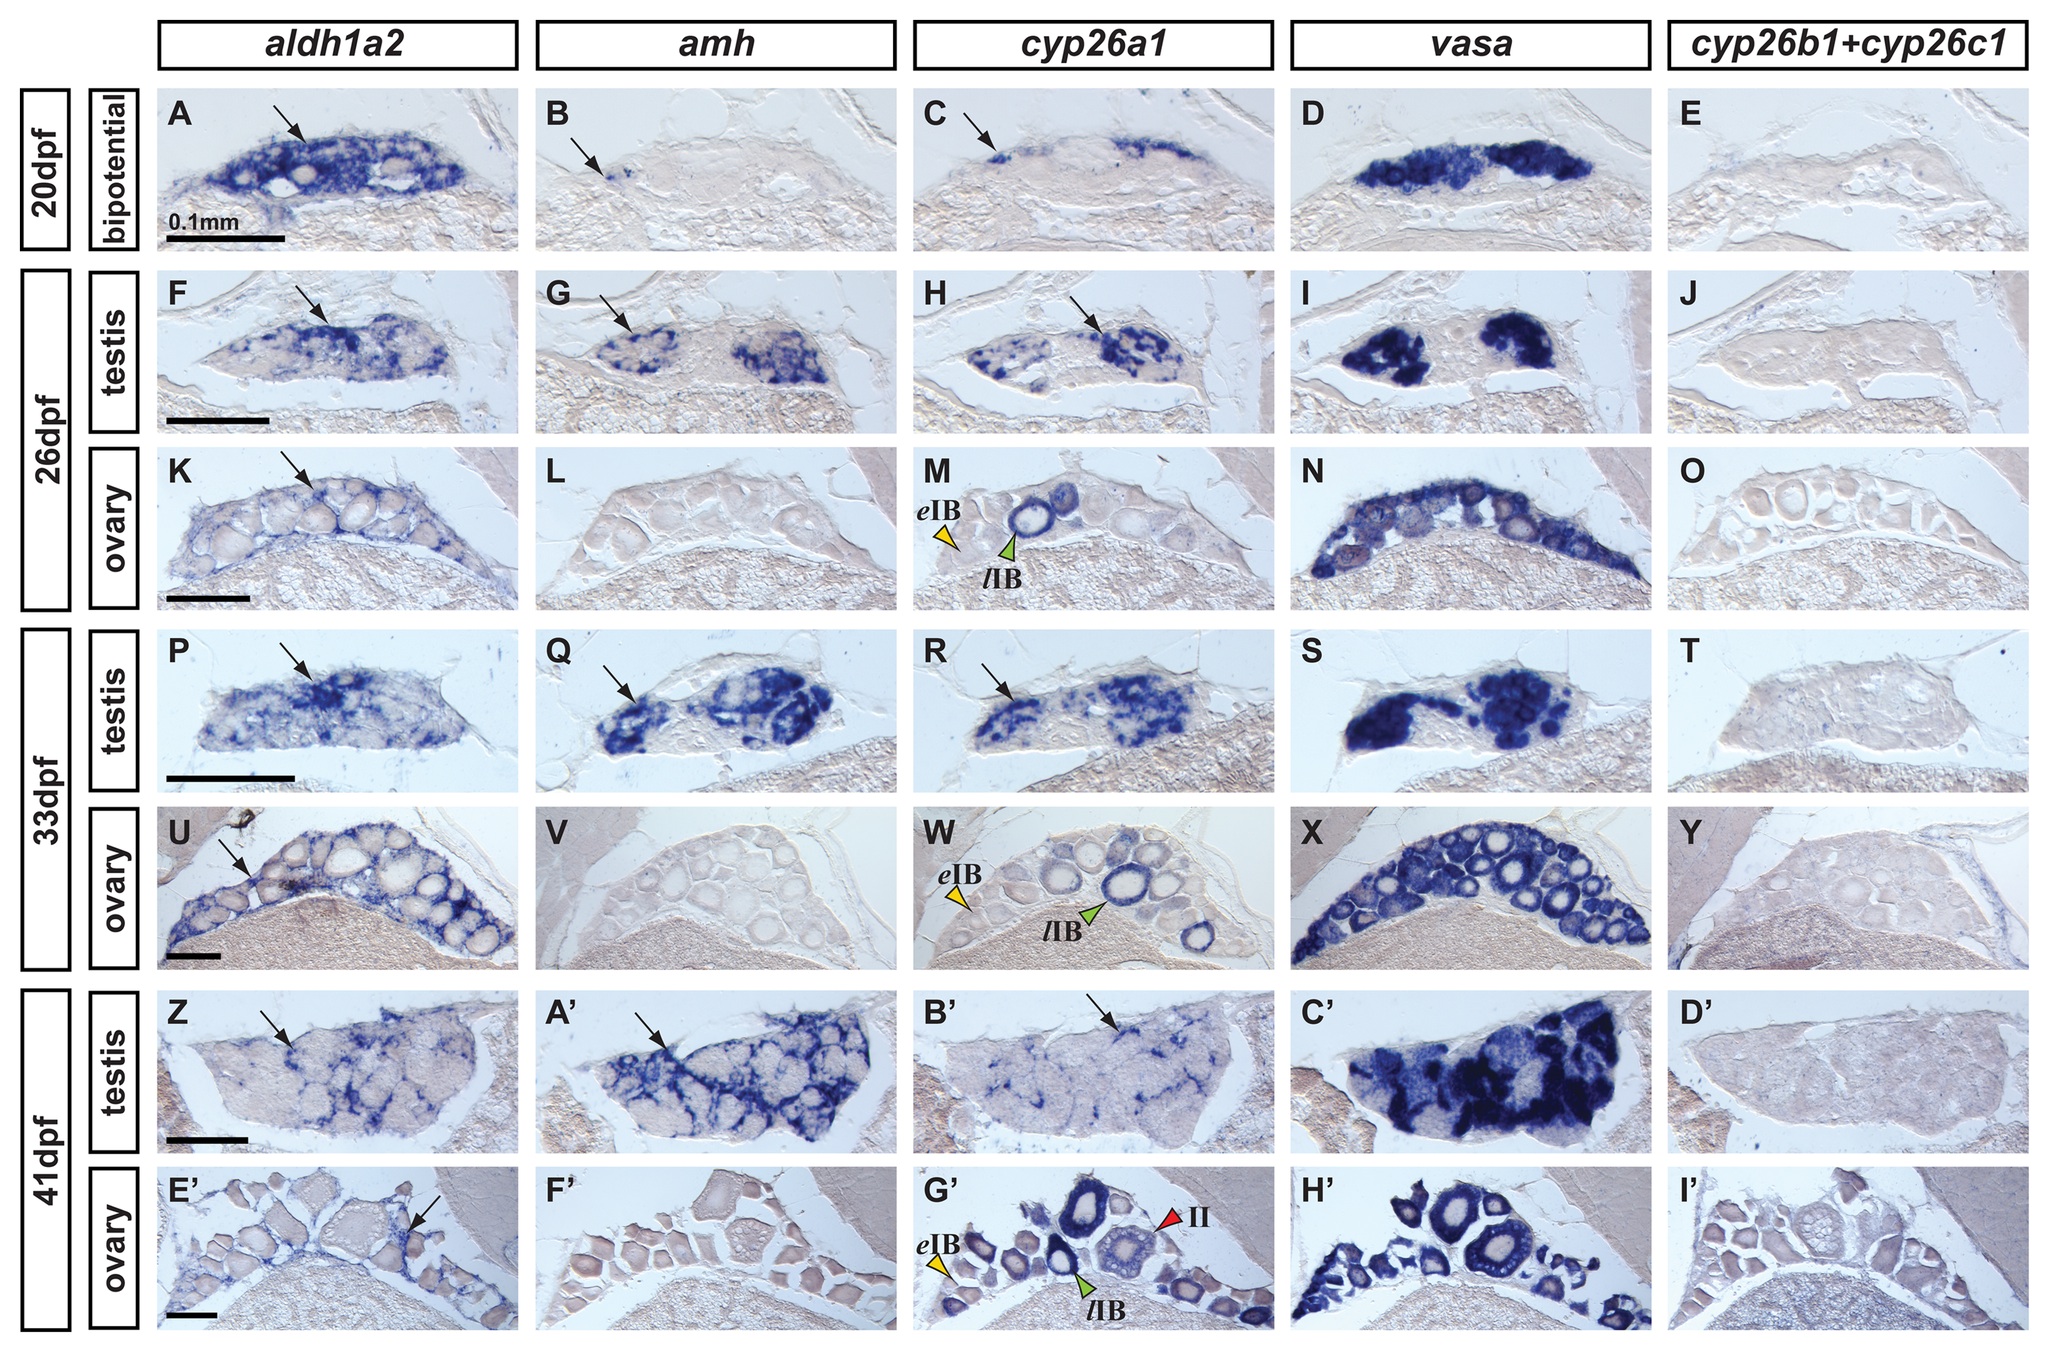
Fig. 4
|
Fig. 4 Expression of genes encoding enzymes for the synthesis and degradation of RA during zebrafish gonad development.
In situ hybridization on adjacent sections of animals representing the three key stages of gonad development: (A–E: n=7) bipotential, sexually undifferentiated gonads with an ovary-like morphology at 20 days post-fertilization (dpf); (F–O) gonads transitioning to testes or ovaries (26 dpf) (F-J: n=4; K–O: n=3); (P–Y and Z–I′) gonads sexually differentiated but still immature (33 dpf and 41 dpf) (P-T: n=3; U–Y: n=4; Z-D′: n=2; E′-I′: n=2). Images show expression patterns of the gene encoding the RA-synthesizing enzyme Aldh1a2 (A, F, K, P, U, Z, E′), the gene encoding the RA-degrading enzyme Cyp26a1 (C, H, M, R, W, B′,G′) and combined probes for cyp26b1 and cyp26c1 (E, J, O, T, Y, D′, I′) together with the early male gonadal marker amh (anti-Müllerian hormone: B, G, L, Q, V & A′, F′) and the germ-line specific marker vasa (D, I, N, S, X, C′, H′) at four different stages. Expression of aldh1a2 was detected in somatic cells in both male and female gonads throughout development (A, F, K, P, U, Z, E′). Expression of aldh1a3 was not detected at all in gonads but was detected in retina cells (data not shown) and the ortholog of Aldh1a1 was lost in the teleost lineage [54-56]. The expression pattern of cyp26a1, however, showed a distinct sexual dimorphism, as gonadal somatic cells from males (H, R and B′), but not from females (M, W, G′), up-regulated its expression during gonad development. Interestingly, in females, oocytes that had transitioned from early stage IB (yellow arrowhead in M,W,G′) to late stage IB (green arrowheads in M,W,G′) up-regulated the expression of cyp26a1 in the ooplasm, which was maintained at later stages (e.g. red arrowhead stage II in G′). The observed expression pattern of cyp26a1 in oocytes is compatible with a function in inhibiting meiotic progression and facilitating the meiotic arrest at diplotene stage. Expression of cyp26b1 and cyp26c1 in gonads was not detected at any of the stages analyzed in either sex (E, J, O, T, Y, D′, I′) Arrows point to examples of expressing cells. Scale bar shown per each row: 0.1mm.