
|
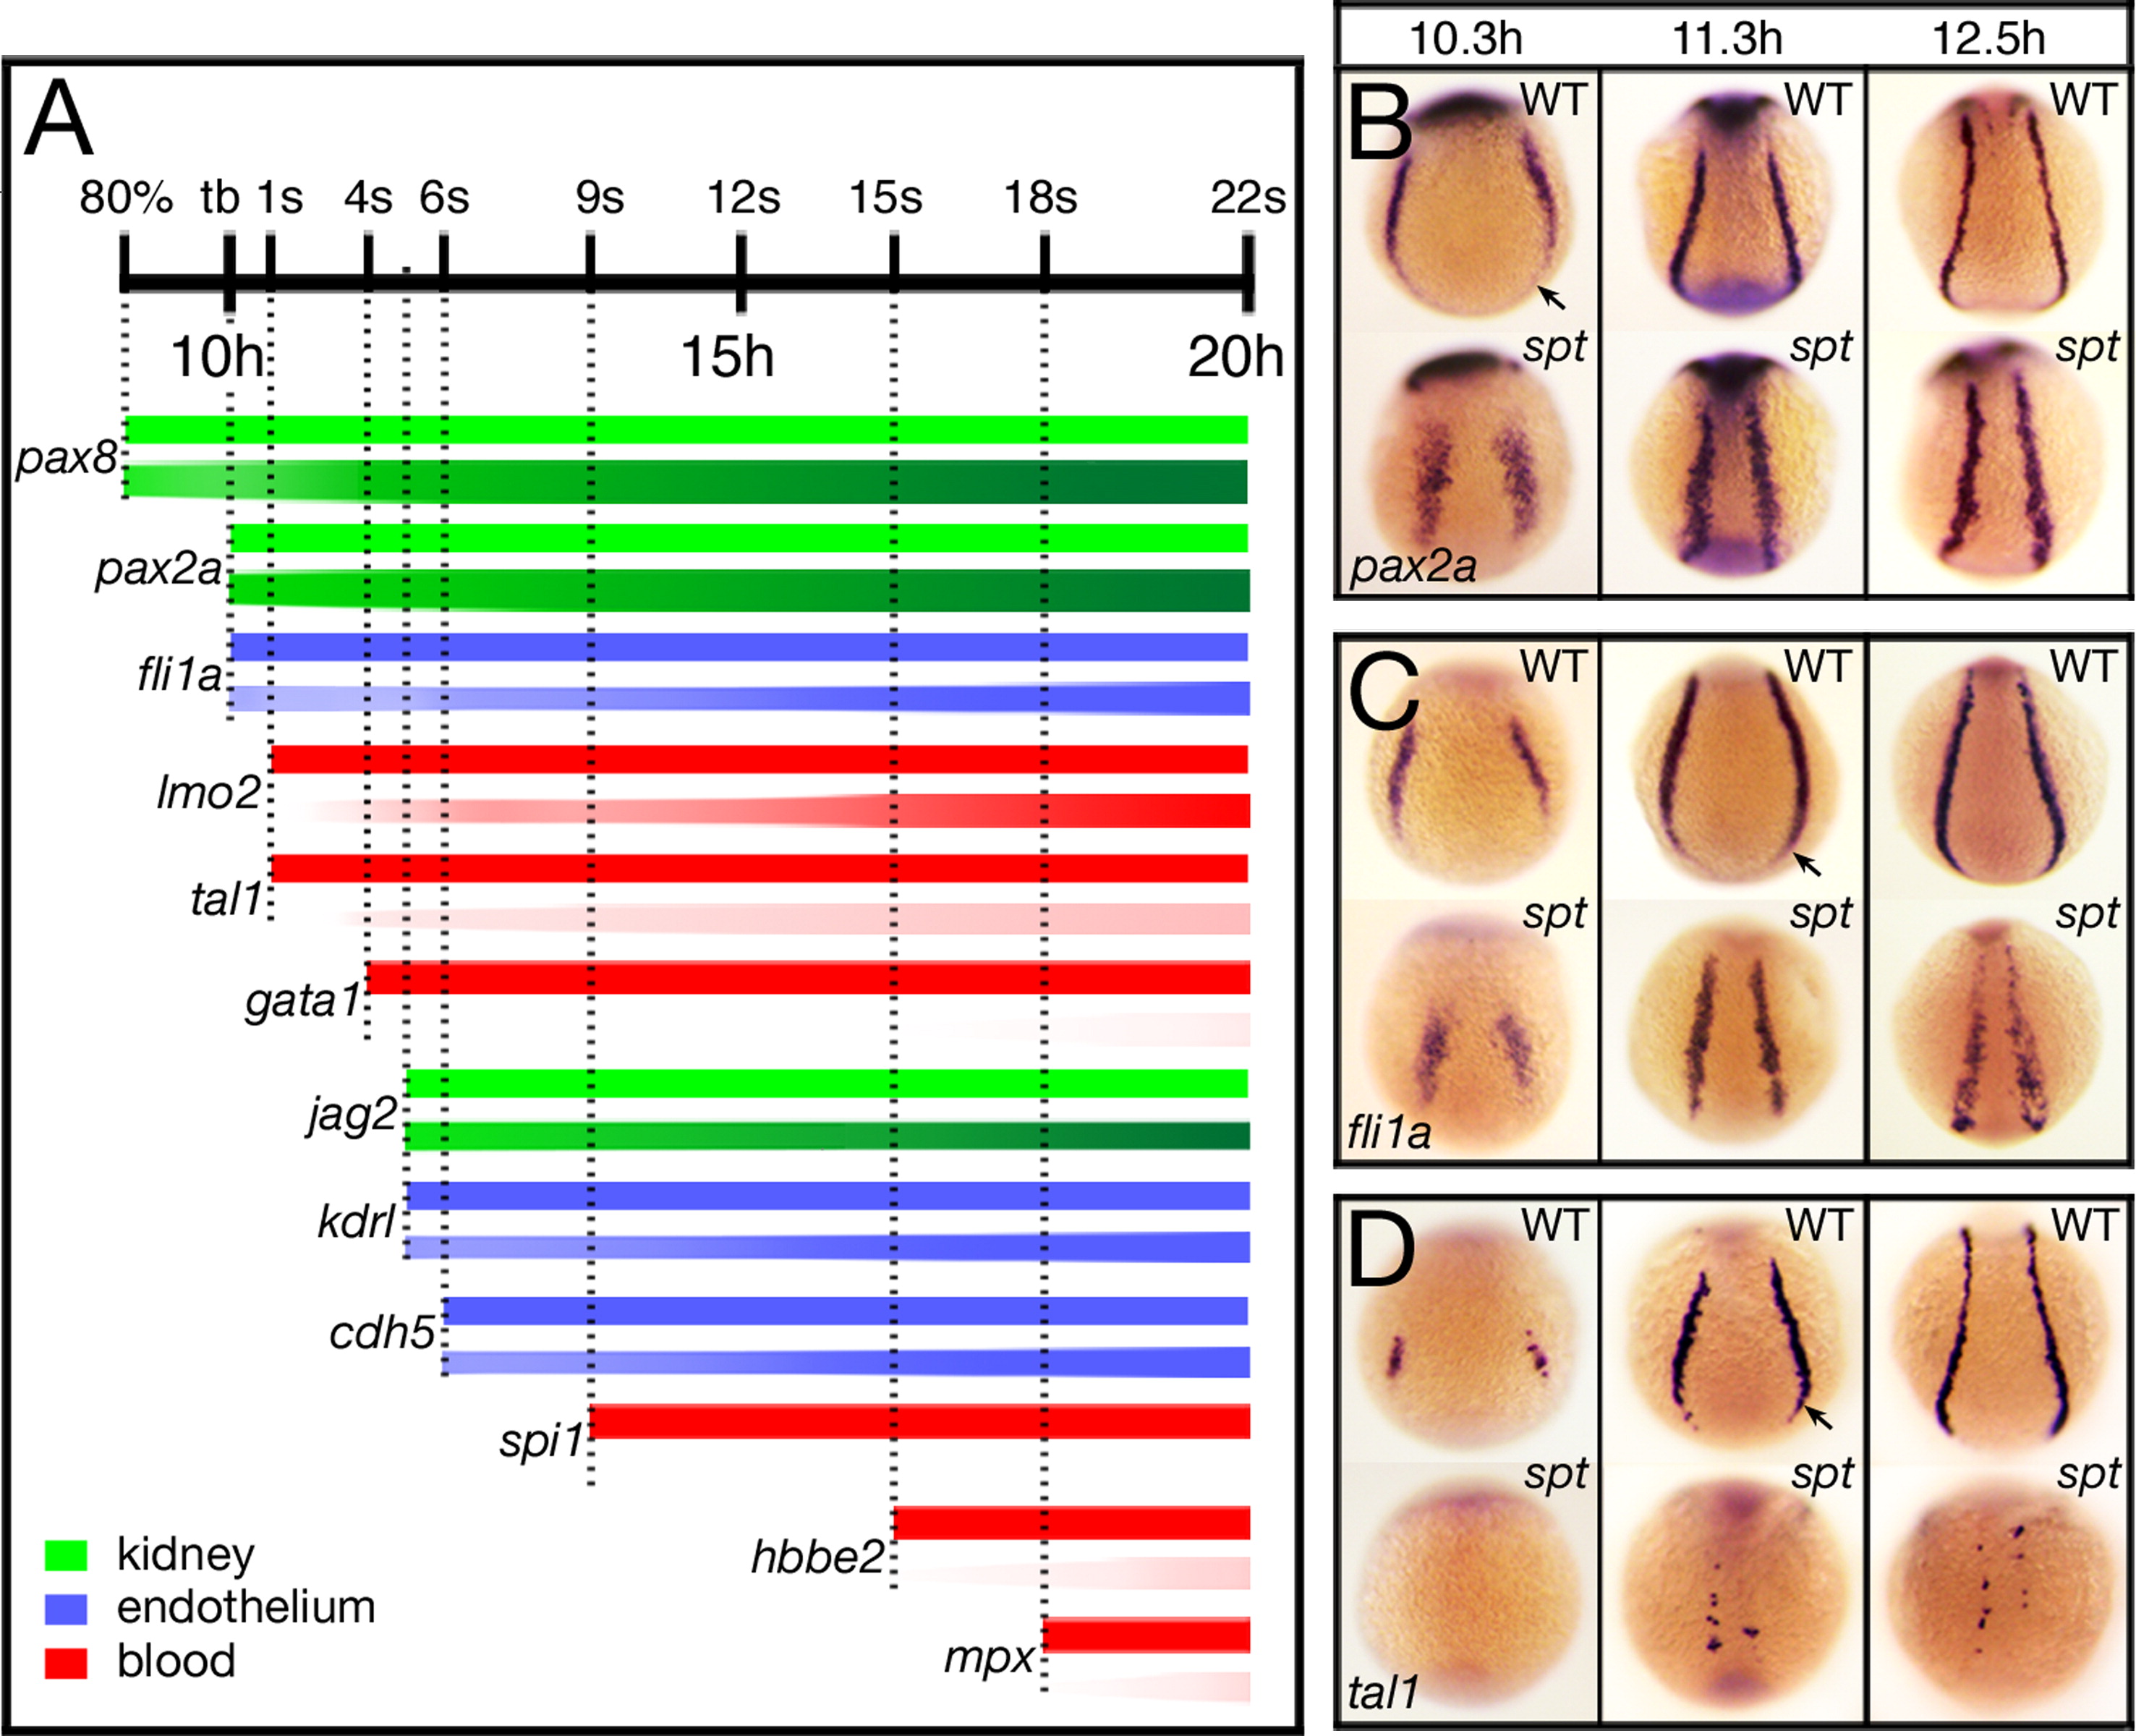
Fig. 3 Spatiotemporal gene expression is altered in the intermediate mesoderm of spt mutants. (A) Temporal expression profiles of nephric (green), endothelial (blue) and hematopoietic (red) genes expressed in the trunk intermediate mesoderm. For each gene, the bar above symbolizes wild-type expression and the bar below mutant expression. Lightness or darkness of color for mutant denotes less or more cells. Vertical dotted lines denote onset of expression in wildtype. Examples of expression are shown in adjacent panels B–D and in Fig. 1, Fig. 2 and Fig. 5 and Supplementary Fig. 2. (B–D) Spatial pattern of trunk intermediate mesoderm genes: (B) pax2a, in nephric progenitors; (C) fli1a, in endothelial progenitors; and (D) tal1, in hematopoietic progenitors. Embryos are shown from a posterior view with dorsal to the top. Arrow designates portion missing in the mutant.
Reprinted from Developmental Biology, 383(1), Warga, R.M., Mueller, R.L., Ho, R.K., and Kane, D.A., Zebrafish Tbx16 regulates intermediate mesoderm cell fate by attenuating Fgf activity, 75-89, Copyright (2013) with permission from Elsevier. Full text @ Dev. Biol.