
|
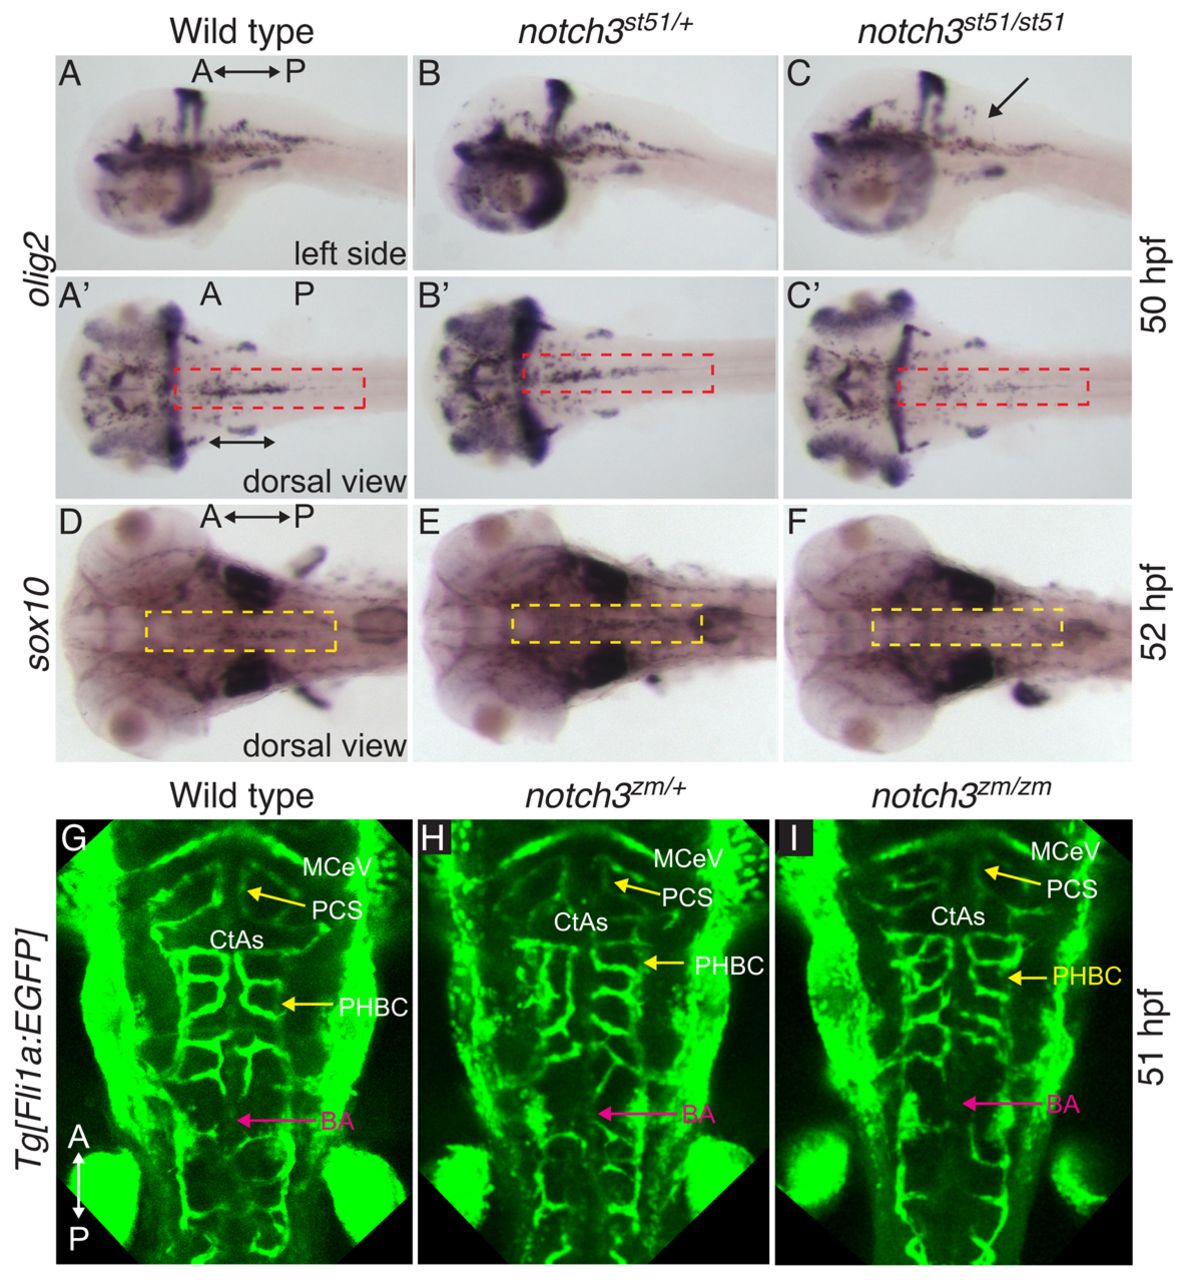
Fig. 2
Transient reduction in OPCs in notch3 mutants at stages at which vessel patterning is intact. (A–C) olig2 at 50 hpf was similar in (A,A2) wild type and (B,B2) notch3st51/+ heterozygotes, but was reduced in OPCs (compare red dashed areas) of (C,C2) notch3st51/st51 mutants. Arrow indicates region devoid of olig2-expressing cells. (D–F) sox10 expression at 52 hpf was comparable in (D) wild type and (E) notch3st51/+ heterozygotes, but was reduced in the midline of the hindbrain (compare yellow dashed areas) in (F) notch3st51/st51 mutants. (A–C) Lateral views. (A2–C2,D–I) Dorsal views. (G–I) Vessel pattern at the anatomical level is intact in notch3zm/zm mutants. Max projection images of Tg[fli1a:EGFP] labeled vasculature of (G) wild type (n=9), (H) notch3zm/+ heterozygotes (n=9) and (I) notch3zm/zm mutants (n=5). CtAs, central arteries; PHBC, primordial hindbrain channel; BA, basilar artery; MCeV, mid-cerebral vein; PCS, posterior connecting segment. The orientation of the anterior (A) and posterior (P) axis is indicated.