
|
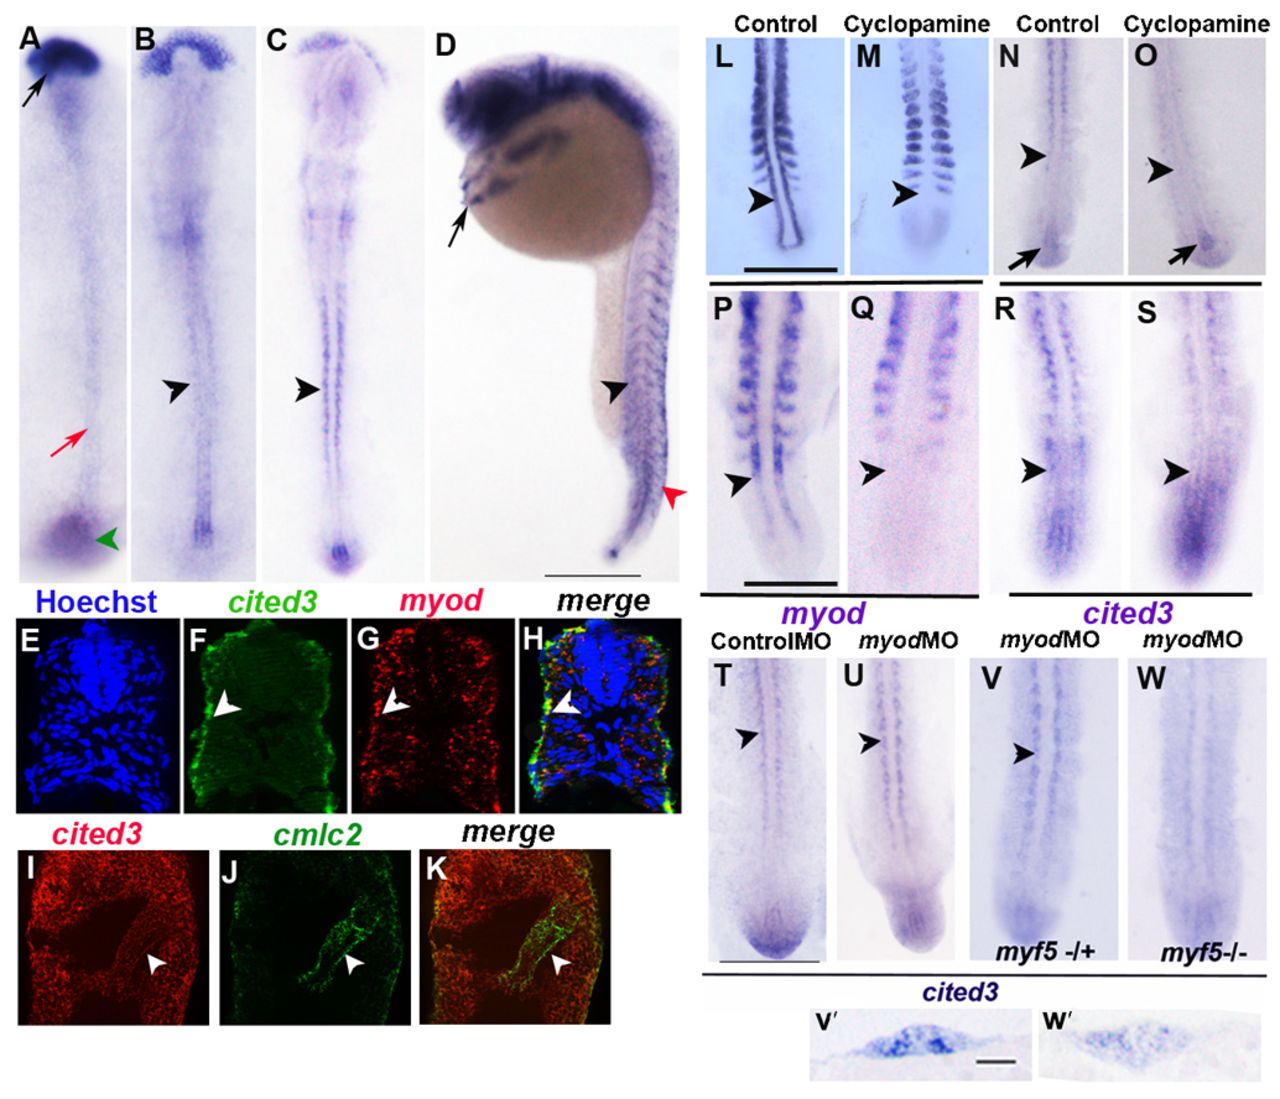
Fig. 1 Expression of cited3 during segmentation stage.
(A) cited3 is expressed in the polster (black arrow) and in the notochord (red arrow) and chordo-neural hinge (green arrowhead) at 10 hpf. (B) At 13 hpf, cited3 is expressed in the adaxial cells (slow muscle precursor; black arrowhead) on either side of the notochord. (C) Expression of cited3 becomes abundant in the slow muscle precursors at 14 hpf. (D) cited3 is also expressed in the differentiated slow muscle cells as indicated by black arrowhead and in the hatching gland as indicated by black arrow and neural crest cells (red arrowhead) at 24 hpf. (E–H) cited3 is expressed in the differentiating slow muscle cells. (E) Cross section of 24 hpf embryo depicting Hoechst staining in the nucleus; (F) cited3 expression in the slow muscle domain; (G) myod expression in the slow and fast muscle domain; (H) merge of cited3 and myod expression in the slow muscle domain (indicated by a white arrowhead). (I–K) cited3 is expressed in the heart precursors. (I) cited3 is expressed in the heart precursors both in the atrium and ventricle (J) cmlc2 expression in the heart precursors (K) merge (ventral view of embryos). (L–S) Expression of cited3 is regulated by the Hedgehog signaling (L,N) Expression of myoD, cited3 was not perturbed in ethanol treated control embryos, (M,O) but expression of myod and cited3 is lost in the adaxial cells in cyclopamine treated (from 5–15hpf) embryos (indicated by arrowhead) whereas myod expression is still retained in the fast muscle (M) and cited3 expression in the chordo-neural-hinge (arrow) (O). In comparison to control ethanol treatment, cyclopamine treatment from 13 to 18 hpf blocked transcription of myod in all adaxial cells (P,Q), but that of cited3 only in adaxial cells located in the presomitic mesoderm (R,S). (T–W) Myod and Myf5 redundantly regulate the expression of cited3. (U) Expression of cited3 was not perturbed in the embryos that were injected with myoD MO compared to those injected with the control MO (T) at 17 hpf. Similarly, expression of cited3 was not affected in 75% of the embryos that were obtained from mating of heterozygous myf5hu202 mutant fishes and injected with the myod MO (22/28) (V,V′). However, expression of cited3 was reduced or lost in the remaining 25% of the embryos from the same clutch injected with myod MO (6/28) (W,W′), while the remaining expression of cited3 is in the neural crest cells. Scale bars: 100μm in D,L,P,T, and 50μm in V′.