
Fig. 3
- ID
- ZDB-IMAGE-121210-16
- Genes
- Antibodies
- Publication
- Shin et al., 2012 - Zebrafish neurofibromatosis type 1 genes have redundant functions in tumorigenesis and embryonic development
- All Figures
- Figures for Shin et al., 2012
|
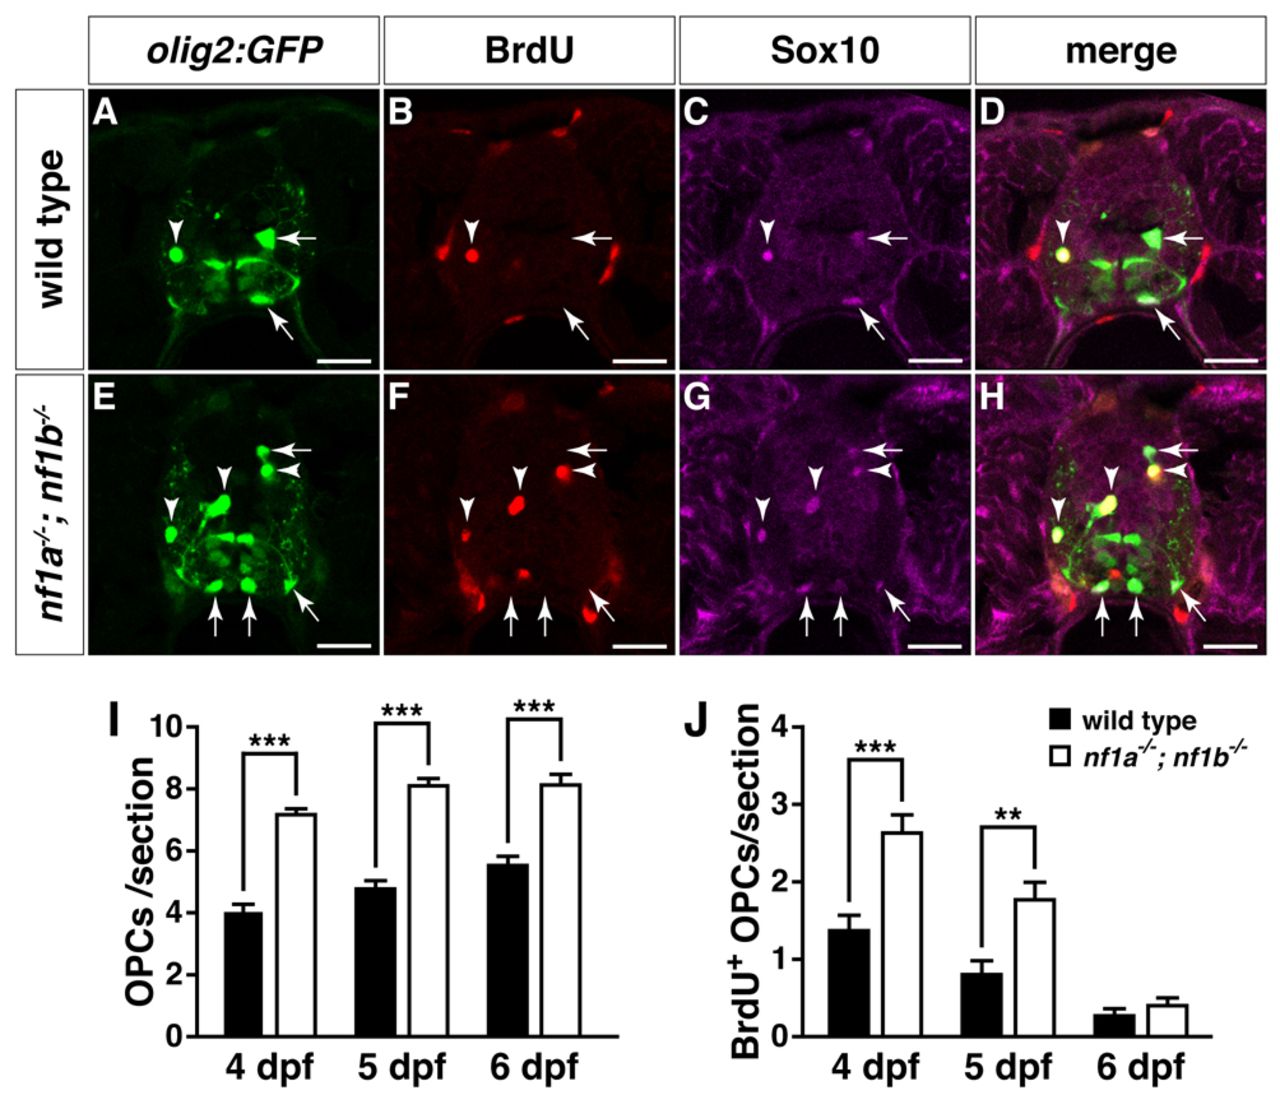
Fig. 3 Increased proliferation drives OPC hyperplasia in nf1a-/-; nf1b-/- larvae. (A-H) Transverse spinal cord sections of wild-type3 Tg(olig2:GFP) (A-D) and nf1a-/-; nf1b-/-; Tg(olig2:GFP) larvae (E-H) labeled with anti-BrdU antibody (B,F, red) or anti-SOX10 antibody (C,G, magenta) at 4 dpf. Arrows indicate BrdU-negative, Tg(olig2:GFP)-, Sox10-positive OPCs. Arrowheads indicate BrdU-positive, Tg(olig2:GFP)-, Sox10-positive OPCs. (I,J) Quantification of total (I) and BrdU-positive OPCs (J) from transverse spinal cord sections of wild-type; Tg(olig2:GFP) and nf1a-/-; nf1b-/-; Tg(olig2:GFP) larvae at 4, 5 and 6 dpf. Values indicate mean + s.e.m. per section (n=30 from five each of wild-type and nf1a-/-; nf1b-/- larvae). **P<0.01; ***P<0.001. Scale bars: 20 μm.