
|
Fig. 4
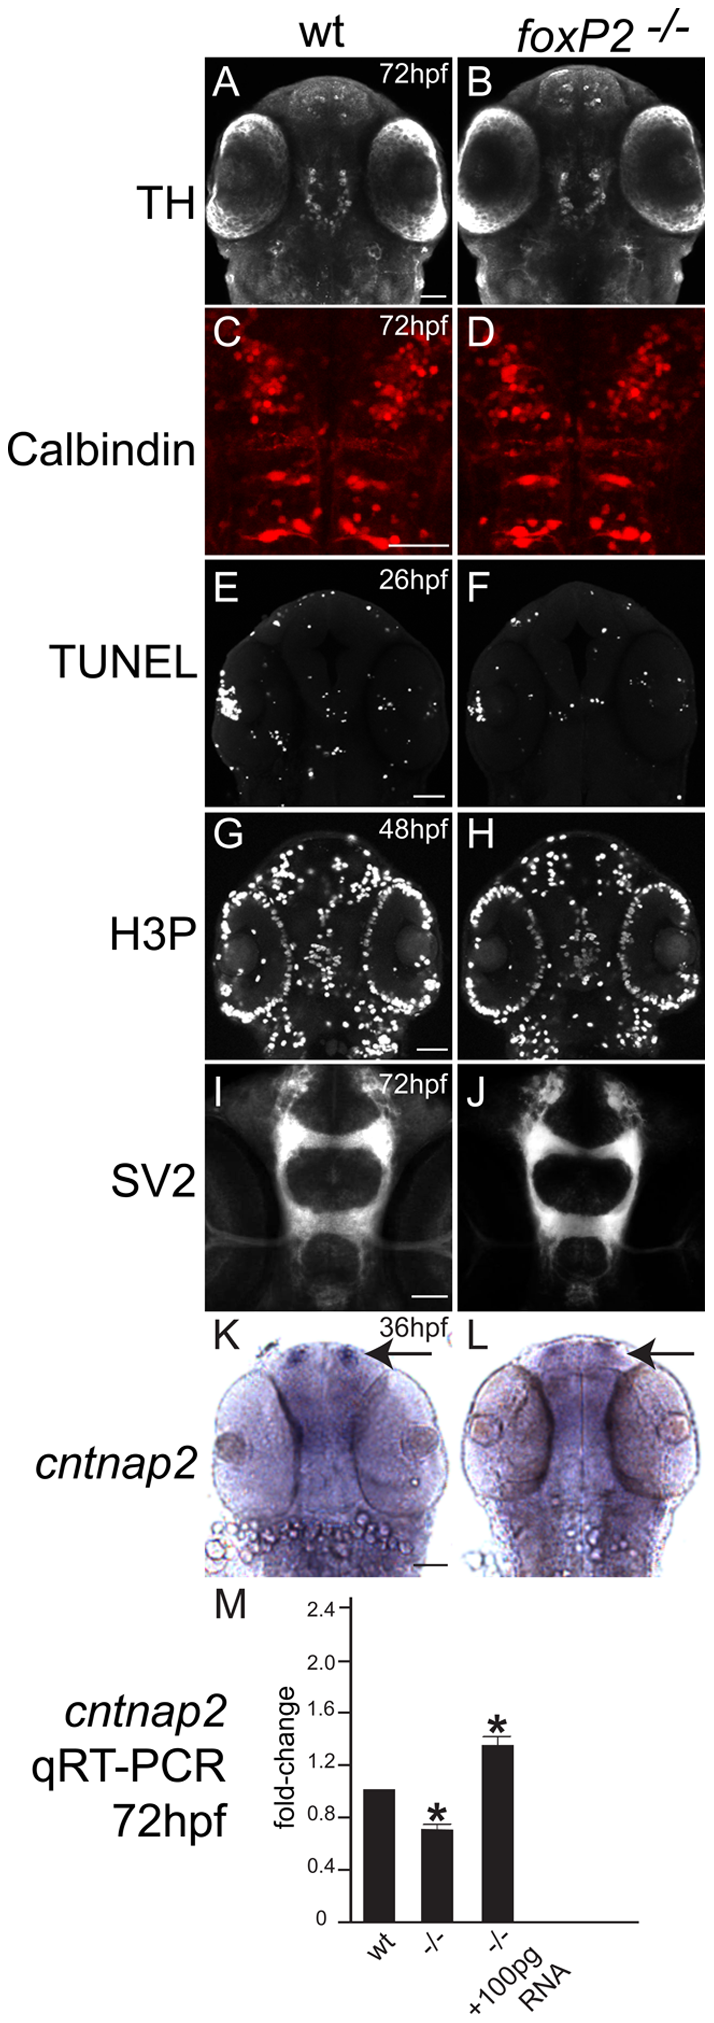
foxP2 does not affect neuron specification, apoptosis, or proliferation, but does affect cntnap2 expression levels.
Confocal z-stack images, rostral to the top, scale bars 50 μm. (A, B, E-H, K-L) ventral views. (C, D) dorsal views. (A, B) TH immunohistochemistry at 72hpf shows no difference in WT and mutants in diencephalic dopaminergic neuron pattern or number. (C, D) Calbindin immunohistochemistry in the dorsal hindbrain at 72hpf shows similar patterns and numbers of Purkinje neurons in WT and mutants. (E, F) TUNEL staining for apoptotic cells at 26hpf in the brain shows no difference in pattern or number of cells between WT and mutants. (G, H) Detection of proliferation by H3P staining is similar in WT and mutants at 48hpf. (I, J) Neuropil distribution and intensity visualized with anti-SV2 synaptic vesicle protein antibody at 72hpf is similar in WT and mutants. (K, L) cntnap2 in situ expression pattern at 36hpf shows less expression in mutant embryos, more noticeably in the telencephalon (arrows). (M) quantitative RT-PCR at 72hpf confirms decreased expression of cntnap2 in mutants, which is rescued by injection with full-length foxP2 mRNA (* p<0.05). Y-axis indicates fold-change.