
IMAGE
Fig. 2
Image
|
Figure Caption
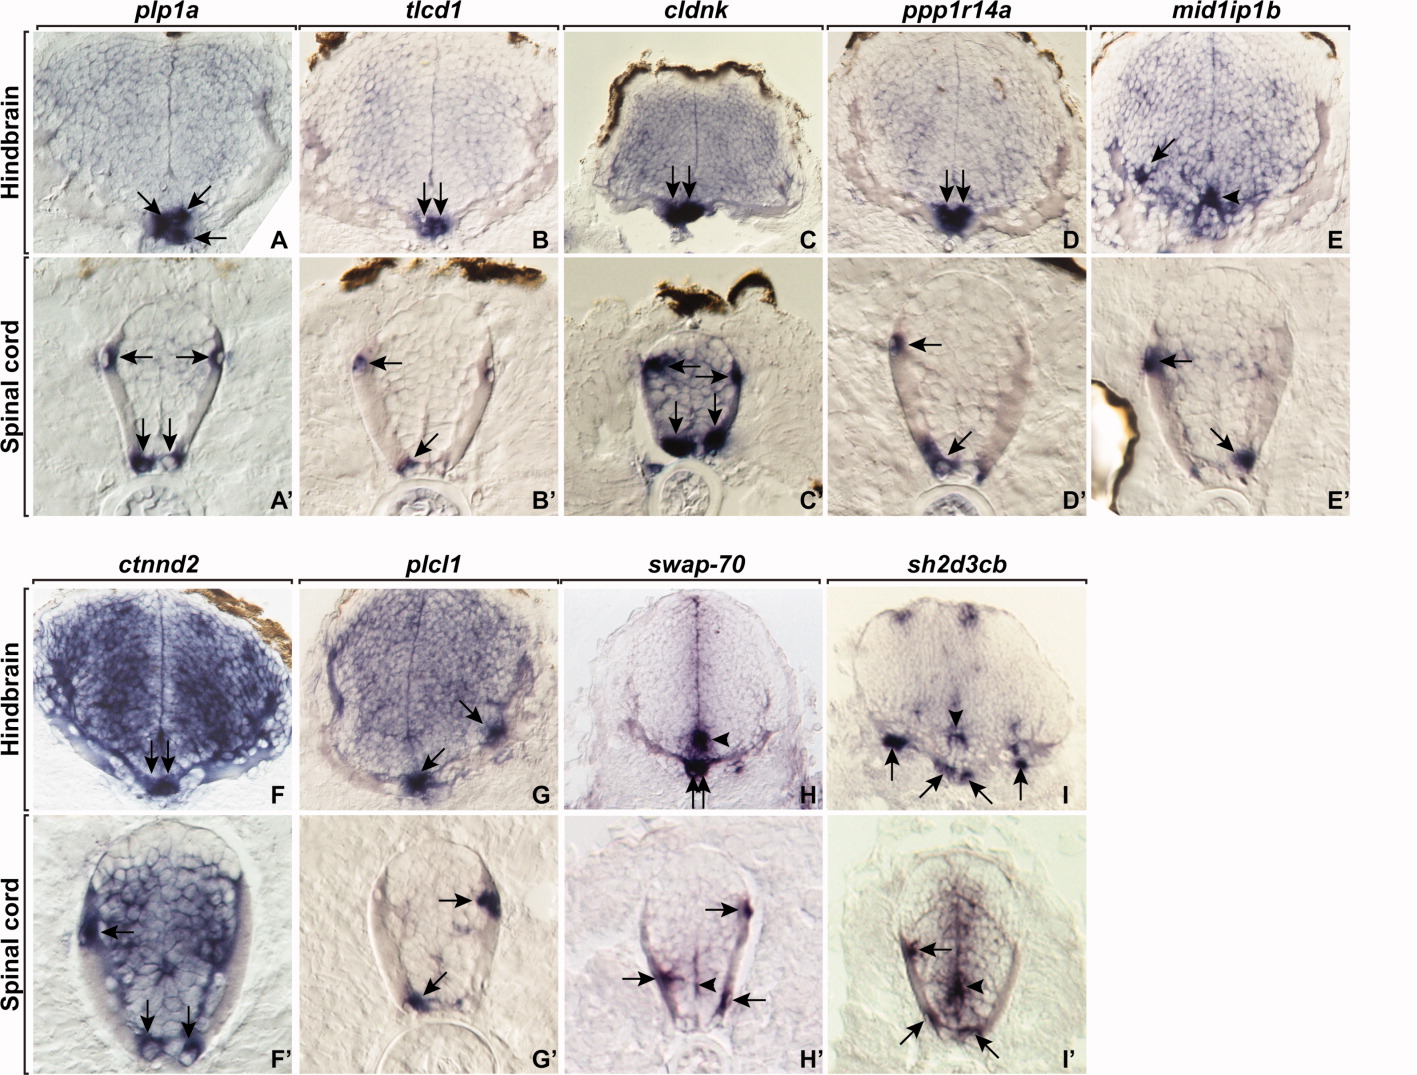
Fig. 2 RNA expression patterns of genes in hindbrain and spinal cord at 4 days postfertilization (dpf). plp1a expression marks differentiating oligodendrocytes. A-I′: Panels show transverse sections of hind brain (A-I) and spinal cord (A′-I′). Arrows indicate expression in oligodendrocytes and arrowheads indicate expression in precursors near the central canal.
Figure Data
Acknowledgments
This image is the copyrighted work of the attributed author or publisher, and
ZFIN has permission only to display this image to its users.
Additional permissions should be obtained from the applicable author or publisher of the image.
Full text @ Dev. Dyn.