
Fig. 4
|
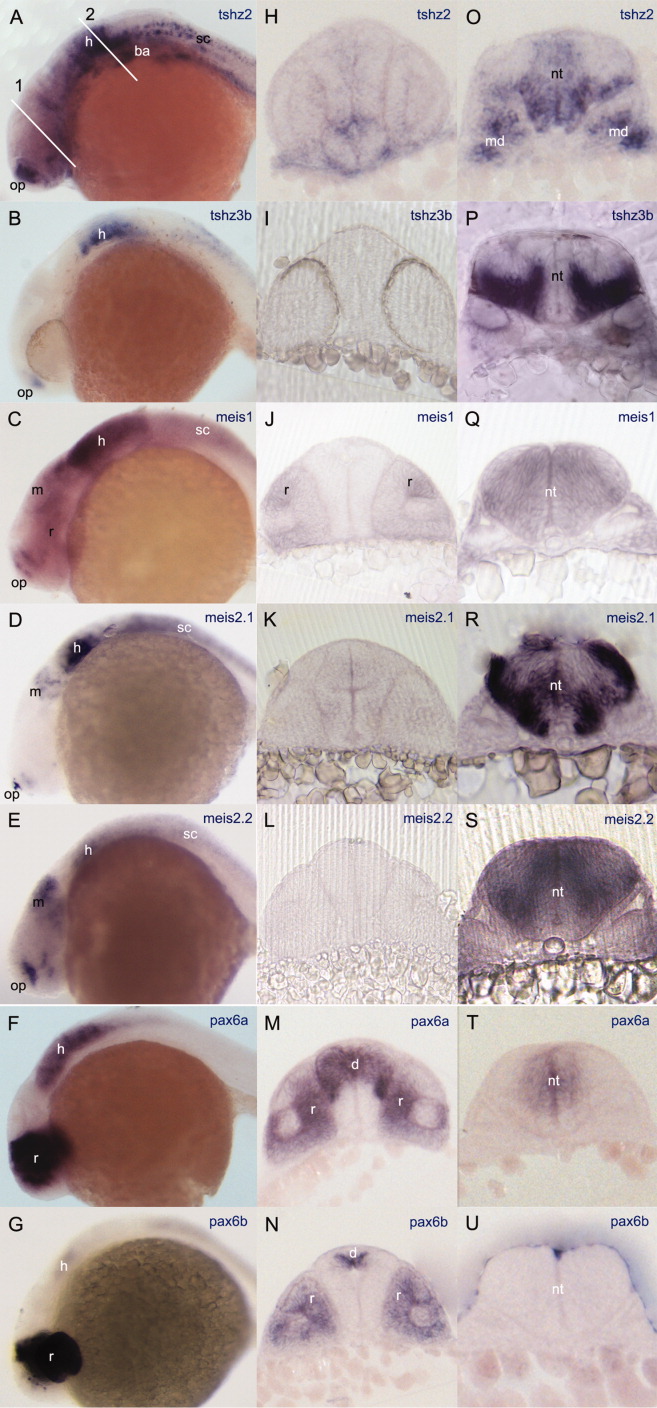
Fig. 4 Spatial expression pattern of tshz2, tshz3b, meis1, meis2.1, meis2.2, pax6a, and pax6b in 24 hours postfertilization (hpf) embryos revealed by RNA in situ hybridization. A-G: Lateral views with dorsal up and anterior to the left. H-U: Transversal vibratome sections at the eyes (left pictures) and rhombomere 5 (right pictures) at the level marked by the lines (1 and 2, respectively) in A. A-G: All genes are expressed in the hindbrain. In Vibratome sections (O-U), it is possible to observe that tshz2 coexpresses with tshz3b, meis, and pax6a, although at different dorsoventral levels. tshz and meis genes also coexpress in the olfactory placodes (A-E) and tshz2 and all the meis genes coexpress in the spinal cord (A,C,D,E). Lines (1) and (2) in A mark the approximate section planes shown in the middle and right columns. ba, branchial arches; d, diencephalon; h, hindbrain; m, midbrain; md, mesoderm; nt, neural tube; op, olfactory placode; r, retina; sc, spinal cord.