
Image
|
Figure Caption
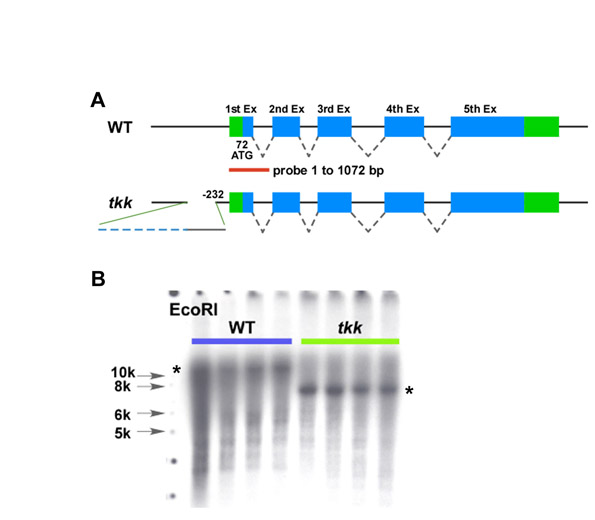
Fig. S5 Detection of the insertion by Southern blotting. (A) Schematic representation of the zebrafish syntabulin gene structure and location of the probe used for Southern blotting analysis. (B) Southern blot. Genomic DNA (10 μg) was isolated from four wild-type and four tkkrk4/rk4 adult fish and digested with EcoRI, followed by Southern hybridization with the probe described in A. A larger than 10 kb band was detected in the wild-type genome, whereas a <7 kb band was detected in the tkk genome (asterisks), indicating alteration of the 5′ syntabulin genomic sequence.
Acknowledgments
This image is the copyrighted work of the attributed author or publisher, and
ZFIN has permission only to display this image to its users.
Additional permissions should be obtained from the applicable author or publisher of the image.
Full text @ Development