
IMAGE
Fig. S2
Image
|
Figure Caption
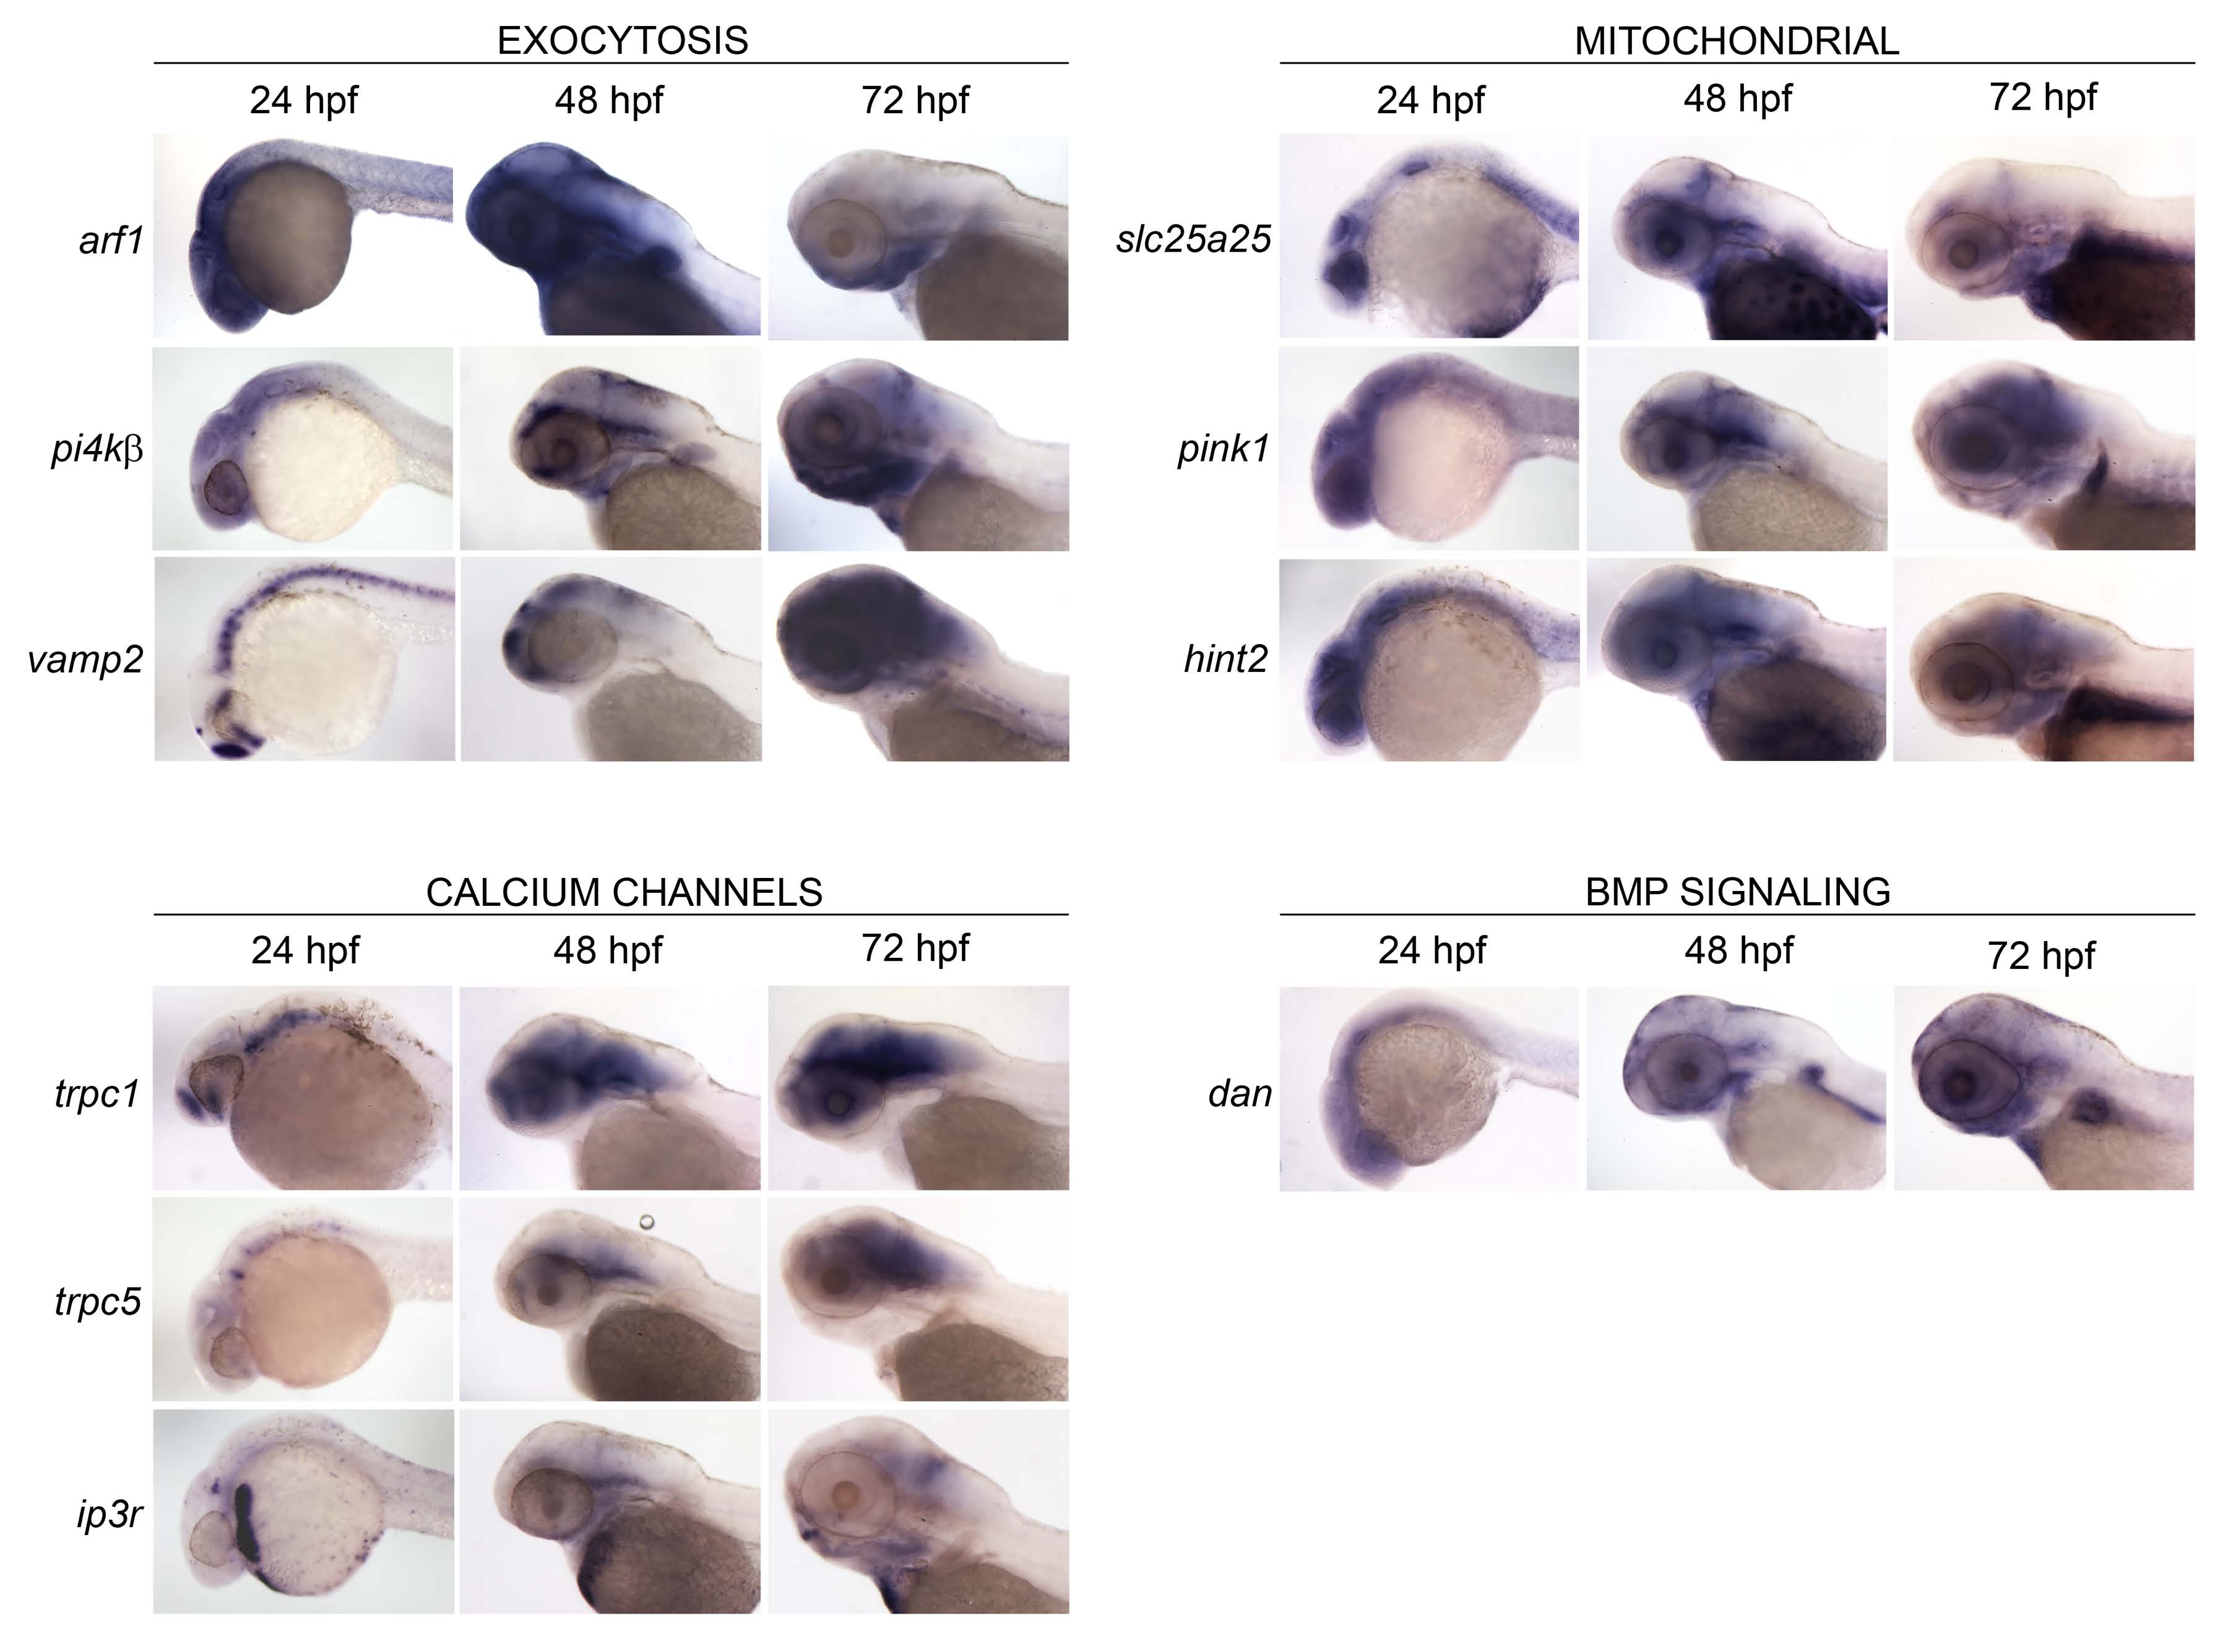
Fig. S2 Expression of zebrafish NBPs in head region. Whole mount in situ hybridization analysis was performed at 24, 48, and 72 hpf. Expression profiles in head region are shown for all of the NBPs represented in Figure 1. Genes are grouped according to presumed functional properties. All images are lateral views of the head, anterior to the left.
Figure Data
Acknowledgments
This image is the copyrighted work of the attributed author or publisher, and
ZFIN has permission only to display this image to its users.
Additional permissions should be obtained from the applicable author or publisher of the image.
Full text @ BMC Neurosci.