
Image
|
Figure Caption
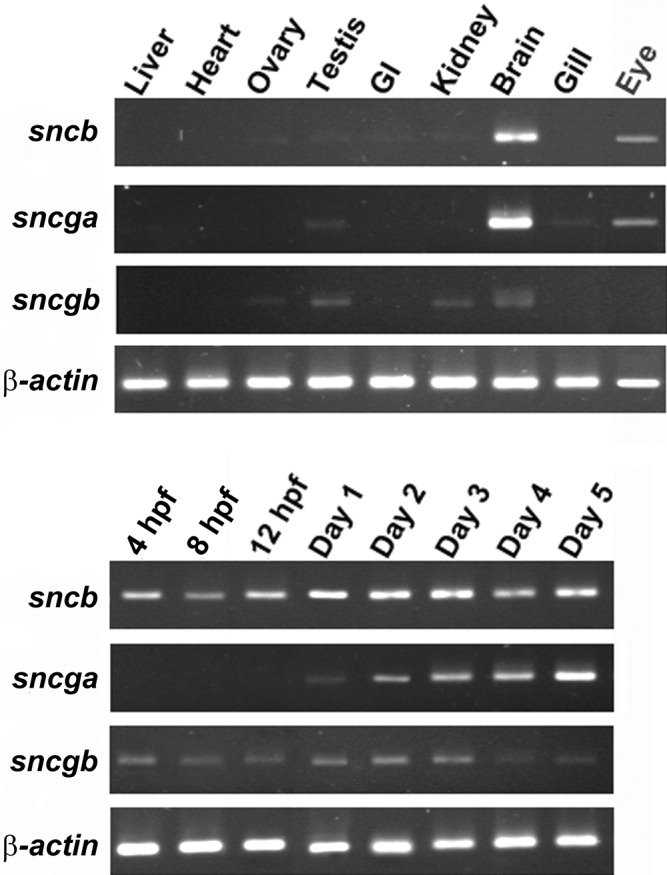
Fig. 2 Expression profiles of zebrafish synuclein-related transcripts in various adult tissues and at different developmental stages by reverse transcriptase-polymerase chain reaction (RT-PCR). A,B: RT-PCR was performed with gene-specific primers. β-actin bands were used to normalize the amount of cDNA prepared from different tissues (A) and from different developmental stages (B). The developmental expression profile of each gene was examined in embryos from 4 hours postfertilization (hpf) to 5 dpf.
Figure Data
Acknowledgments
This image is the copyrighted work of the attributed author or publisher, and
ZFIN has permission only to display this image to its users.
Additional permissions should be obtained from the applicable author or publisher of the image.
Full text @ Dev. Dyn.