
Fig. 5
|
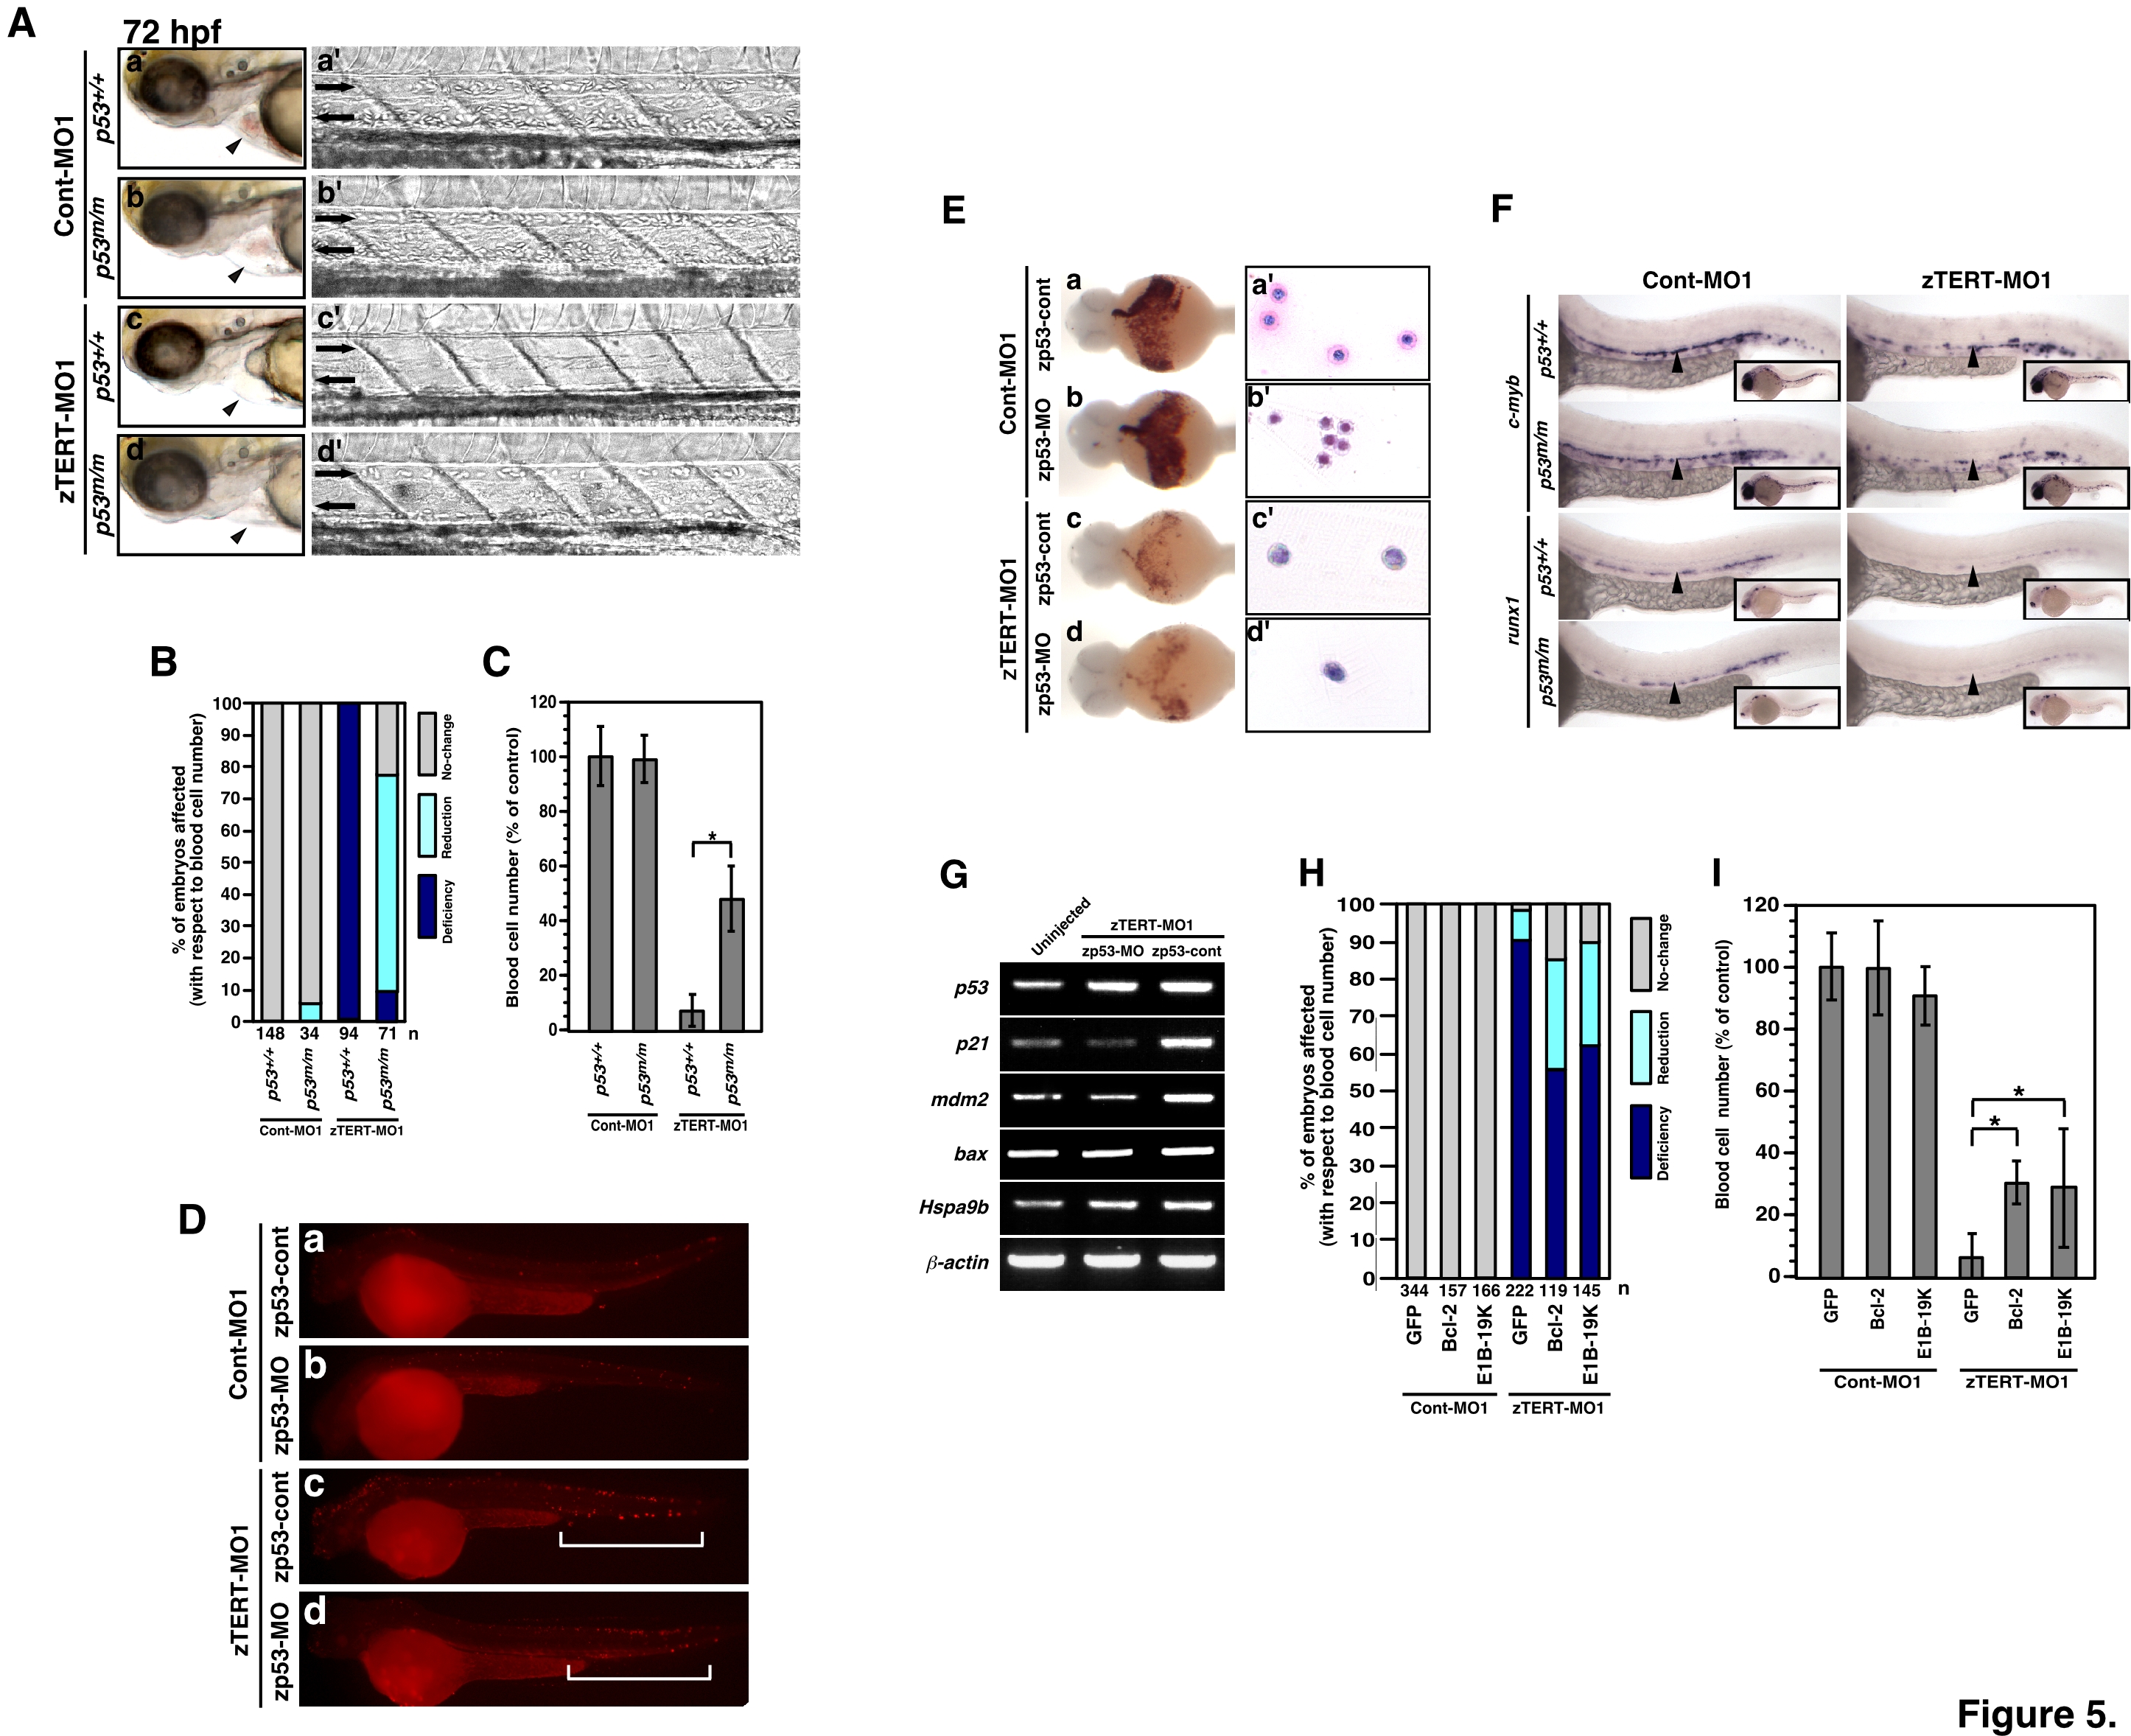
Fig. 5 Rescue of cytopenia, but not anemia, in zTERT morphant embryos with a p53-deficient background.
(A) Lateral views (anterior to left) of wild-type (p53+/+) and homozygous p53M214K mutant (p53m/m) embryos injected with TERT-MO1 (a–d). Arrowheads indicate the heart regions, including the blood (a′–d′) and views of the artery and veins (anterior to left) in the trunk at 72 hpf. (B) Scoring system based on the number of circulating blood cells at 72 hpf after injection of zTERT-MO1 or Cont-MO1 into p53+/+ and p53m/m embryos. We divided the embryos into three classes based on their flowing blood cell number: i) indistinguishable from the control (>90%; no change) as indicated by the gray bar, ii) cell number reduction compared with the control (10–90%; reduction) as indicated by the light-blue bar, and iii) severely deficient or almost no flowing blood cells (<10%; deficiency) as indicated by the dark-blue bar. (C) Percentages of the control levels of circulating blood cell numbers at 72 hpf after the injection of zTERT-MO1 or Cont-MO1 into p53+/+ and p53m/m embryos. Blood cell numbers were counted in 10 embryos from each group. *P<0.01 (Student t-test). (D) Whole-mount TUNEL staining in control and zTERT-knockdown embryos coinjected with either zp53-MO- or zp53-control-MO at 48 hpf (a–d). A representative region of TUNEL-positive cells is indicated by the brackets (c, d). (E) Whole-mount o-dianisidine staining of hemoglobin in control and TERT-knockdown embryos coinjected with either zp53-MO or zp53-control-MO at 48 hpf. The intensity of the blood flow color over the yolk indicates the hemoglobin concentration (a–d). Wright-Giemsa staining of isolated blood cells from Cont-MO1- and zTERT-MO1-injected embryos in a p53-deficient background at 48 hpf (a′–d′). (F) Whole-mount in situ hybridization of control and TERT-knockdown embryos for c-myb and runx1 expression in p53+/+ and p53m/m embryos. The expression in the arterial region is indicated by arrowheads. (G) Altered expression levels of the indicated genes in TERT-deficient embryos in a p53-deficient background. Genes involved in the p53 pathway were analyzed by single-embryo RT-PCR. Similar results (data not shown) were obtained from this analysis of a number of individual embryos (more than 10 embryos for each gene). (H) Scoring of the number of circulating blood cells at 72 hpf after co-injection of zTERT-MO1 or Cont-MO1 and either GFP-, hBcl-2-, or E1B-19K-cDNA vectors. Embryos are classified as in (B). (I) Circulating blood cell numbers as a percentage of the control at 72 hpf after co-injection of zTERT-MO1 or Cont-MO1 and either GFP-control, hBcl-2, or E1B-19K expressing vectors. Blood cell numbers were counted in 10 embryos for each group. *P<0.01 (Student t-test).