
|
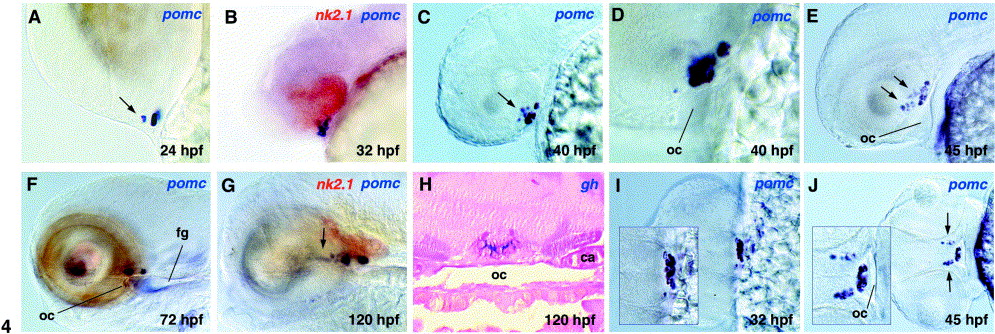
Fig. 4 The pituitary anlage moves into the head via a common invagination of the hypophyseal-stomodeal placode. (A–G, I, J) pomc expression. (H) gh expression. Embryos in (B) and (G) are counterstained for nk2.1 in red. Ages of embryos are indicated in bottom-right corner (hpf, hours after fertilization). (A–G) Lateral views. (H) Transverse section through pituitary (compare with histological sections of larvae at 72 and 120 hpf at http://zfin.org/zf_info/anatomy/dev_atlas.html). (I, J) Frontal views (with magnification of pituitary region in insets). (D) Magnified pituitary region of embryo shown in (C). Putative hypothalamic pomc-positive cells in (A, C, E, G, J) are indicated by arrows. Note the progressive spreading of pomc-positive cells along the anteroposterior axis in (A–E), leading to two distinct pomc domains at the anterior and posterior ends of the pituitary anlage (F, G). Abbreviations: oc, oral cavity; fg, foregut; ca, cartilage.
Reprinted from Developmental Biology, 254(1), Herzog, W., Zeng, X., Lele, Z., Sonntag, C., Ting, J.W., Chang, C.Y., and Hammerschmidt, M., Adenohypophysis formation in the zebrafish and its dependence on sonic hedgehog, 36-49, Copyright (2003) with permission from Elsevier. Full text @ Dev. Biol.