
Fig. 2
- ID
- ZDB-IMAGE-080411-61
- Publication
- Delalande et al., 2008 - Zebrafish sip1a and sip1b are essential for normal axial and neural patterning
- All Figures
- Figures for Delalande et al., 2008
|
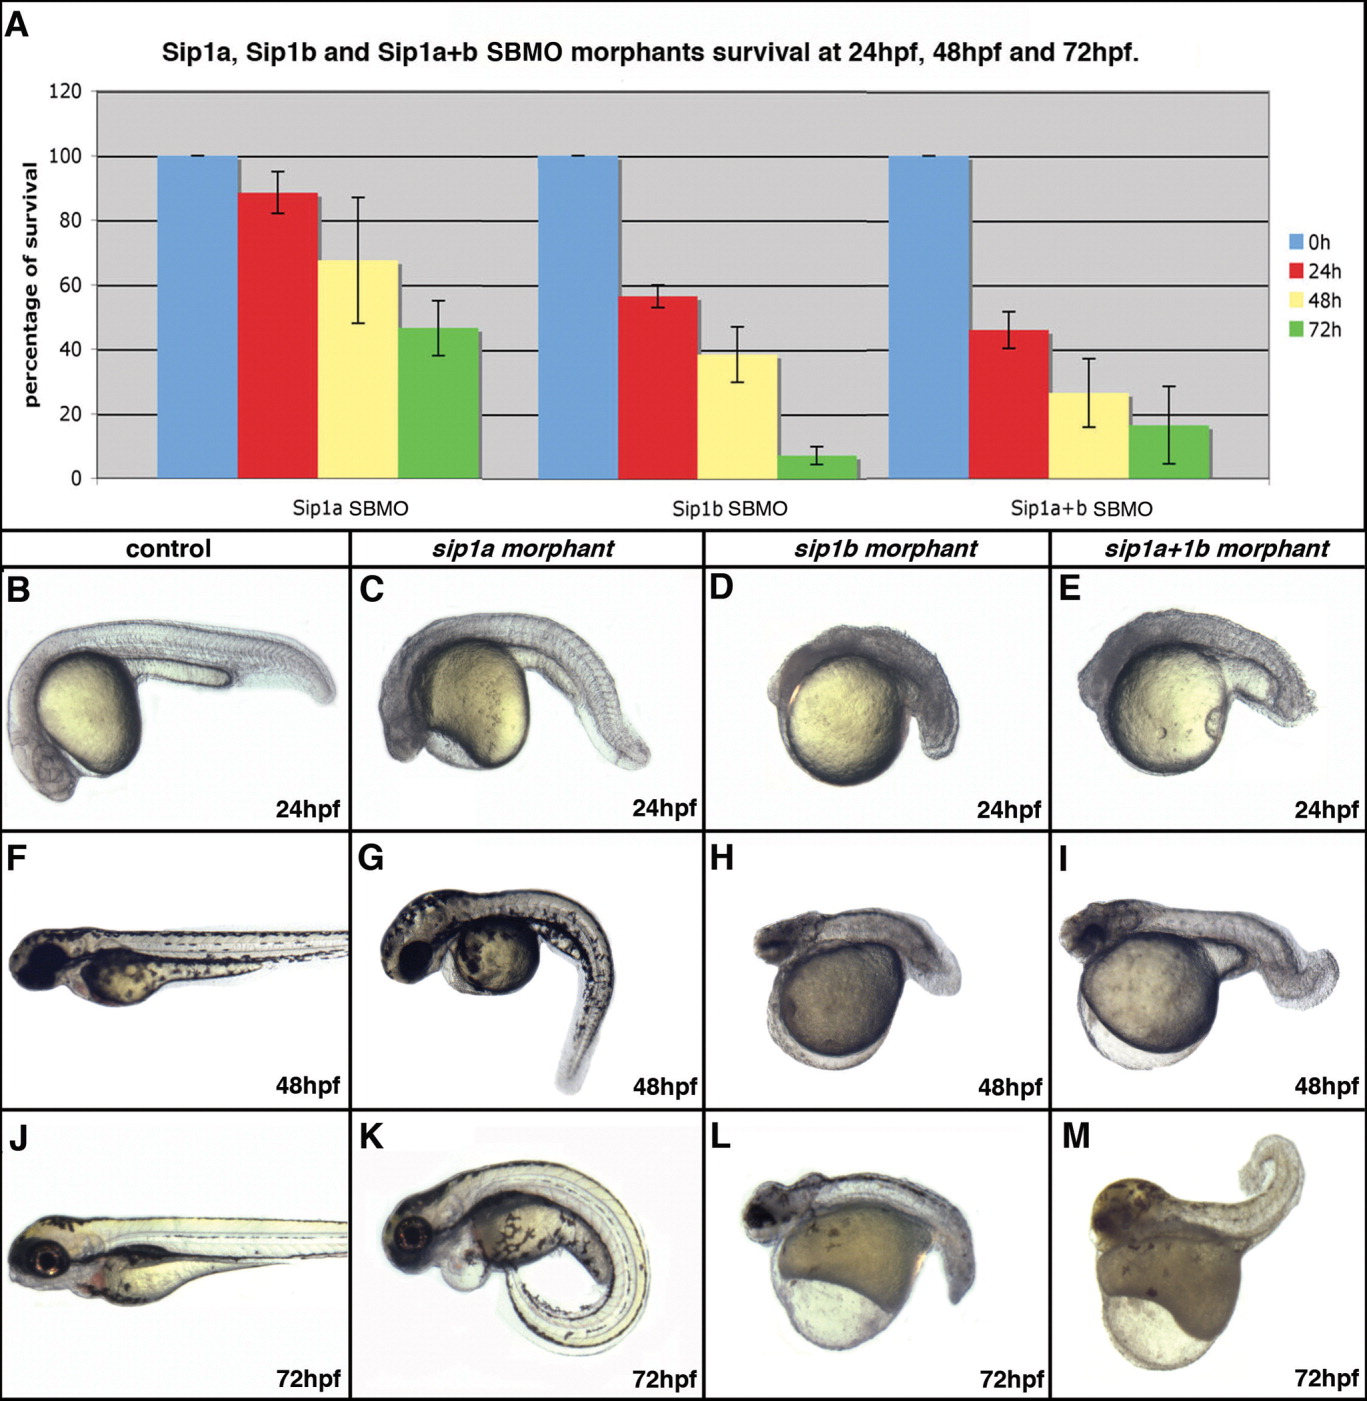
Fig. 2 Effect of sip1a and sip1b splice blocking antisense morpholino oligonucleotide injection on survival and morphological development at 24-72hpf. A: Bar graph showing the percent of surviving sip1a SBMO morphants, sip1b SBMO morphants, and sip1a sip1b double morphants at 24, 48, and 72 hpf. The numbers represent the percent of injected embryos surviving at each specific time point ± s.e.m. based on 3 independent experiments. B-M: Lateral views of control (B, F, J), sip1a morphant (C, G, K), sip1b morphant (D, H, L), and sip1a sip1b double morphant (E, I, M) embryos at 24hpf (B-E), 48hpf (F-I), and 72 (J-M) hpf. Anterior is to the left.