
|
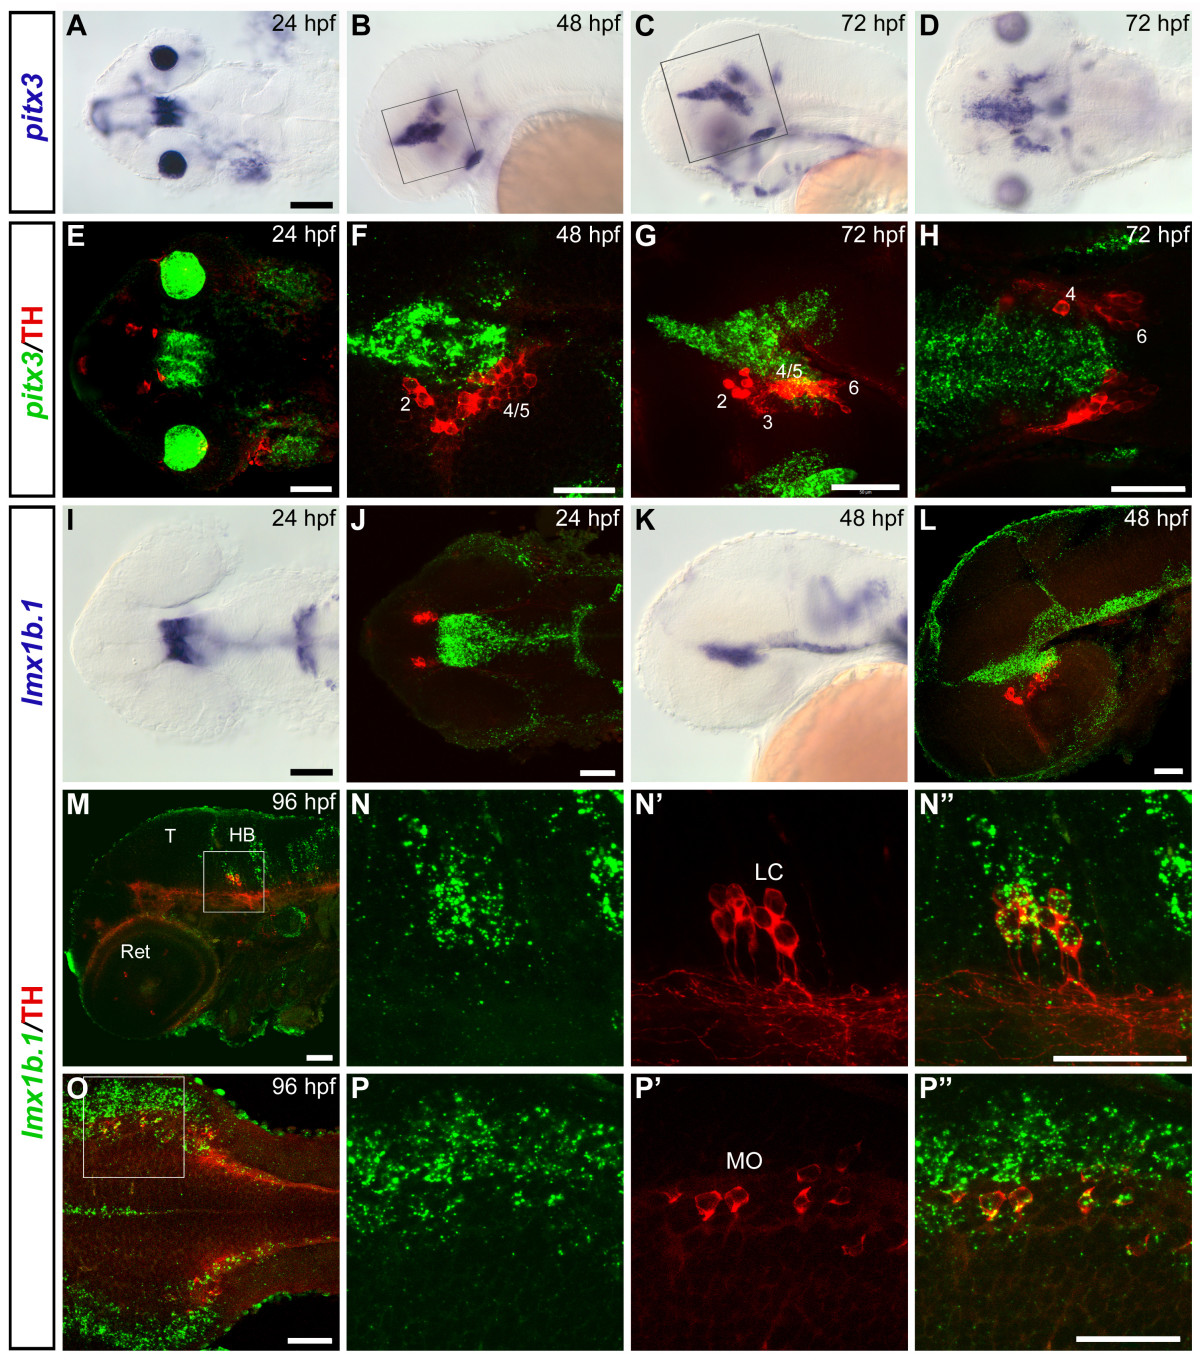
Fig. 4 Expression domains of pitx3 and lmx1b.1 genes in relation to catecholaminergic groups. (A-D) Whole mount in situ hybridization showing pitx3 expression pattern at 24 hpf (A, dorsal view), 48 hpf (B, lateral view) and 72 hpf (C, lateral view, and D, dorsal view). (E-H) Confocal z-projections of whole mount FISH to pitx3 (green) and anti-TH immunohistochemistry (red) revealing the spatial relationship between pitx3-expressing and THir cells. (E) Dorsal overview of the head at 24 hpf (35 µm projection). (F) Single plane confocal image of a 48 hpf embryo, the approximate diencephalic area framed in B is showed. (G) Lateral view (38 µm projection) of a 72 hpf embryo (area framed in C). (H) Single dorsal plane showing the diencephalic area of a 72 hpf embryo: pitx3 expression is mainly detectable in medial and dorsal position with respect to the THir neurons of the posterior tuberculum, and no co-localization can be detected with any DA group (see also additional file 5). (I-L) Expression profile of lmx1b.1 at 24 hpf (I-J) and 48 hpf (K-L) analyzed by traditional WISH (I, K) or by whole mount FISH (J, L, green) and anti-TH immunohistochemistry (J, L, red). Dorsal (I-J) and lateral (K-L) views are represented. J and L are 35 μm and 17 μm confocal projections respectively. No co-expression of lmx1b.1 and TH is detected in the DA neurons of the posterior tuberculum. Double labelling is instead observed in the NA neurons of the locus coeruleus (LC) (M-N″) and medulla oblongata (MO) (O-P″). (M) Single confocal image at the level of the locus coeruleus of a 96 hpf embryo. High magnification of the framed area is showed in N-N" (23 μm projection). (O) Dorsal overview of the medulla oblongata in a 96 hpf embryo (4 µm projection). A high magnification of the framed area is showed in P-P" (single plane) (see also additional files 6 and 7). Anterior is always to the left. Scale bars in A and I (for A-D and I, K): 100 μm; all the other scale bars: 50 μm. Abbreviations: HB, hindbrain; LC, locus coeruleus; MO, medulla oblongata; T, tectum; Ret, retina.