
Image
|
Figure Caption
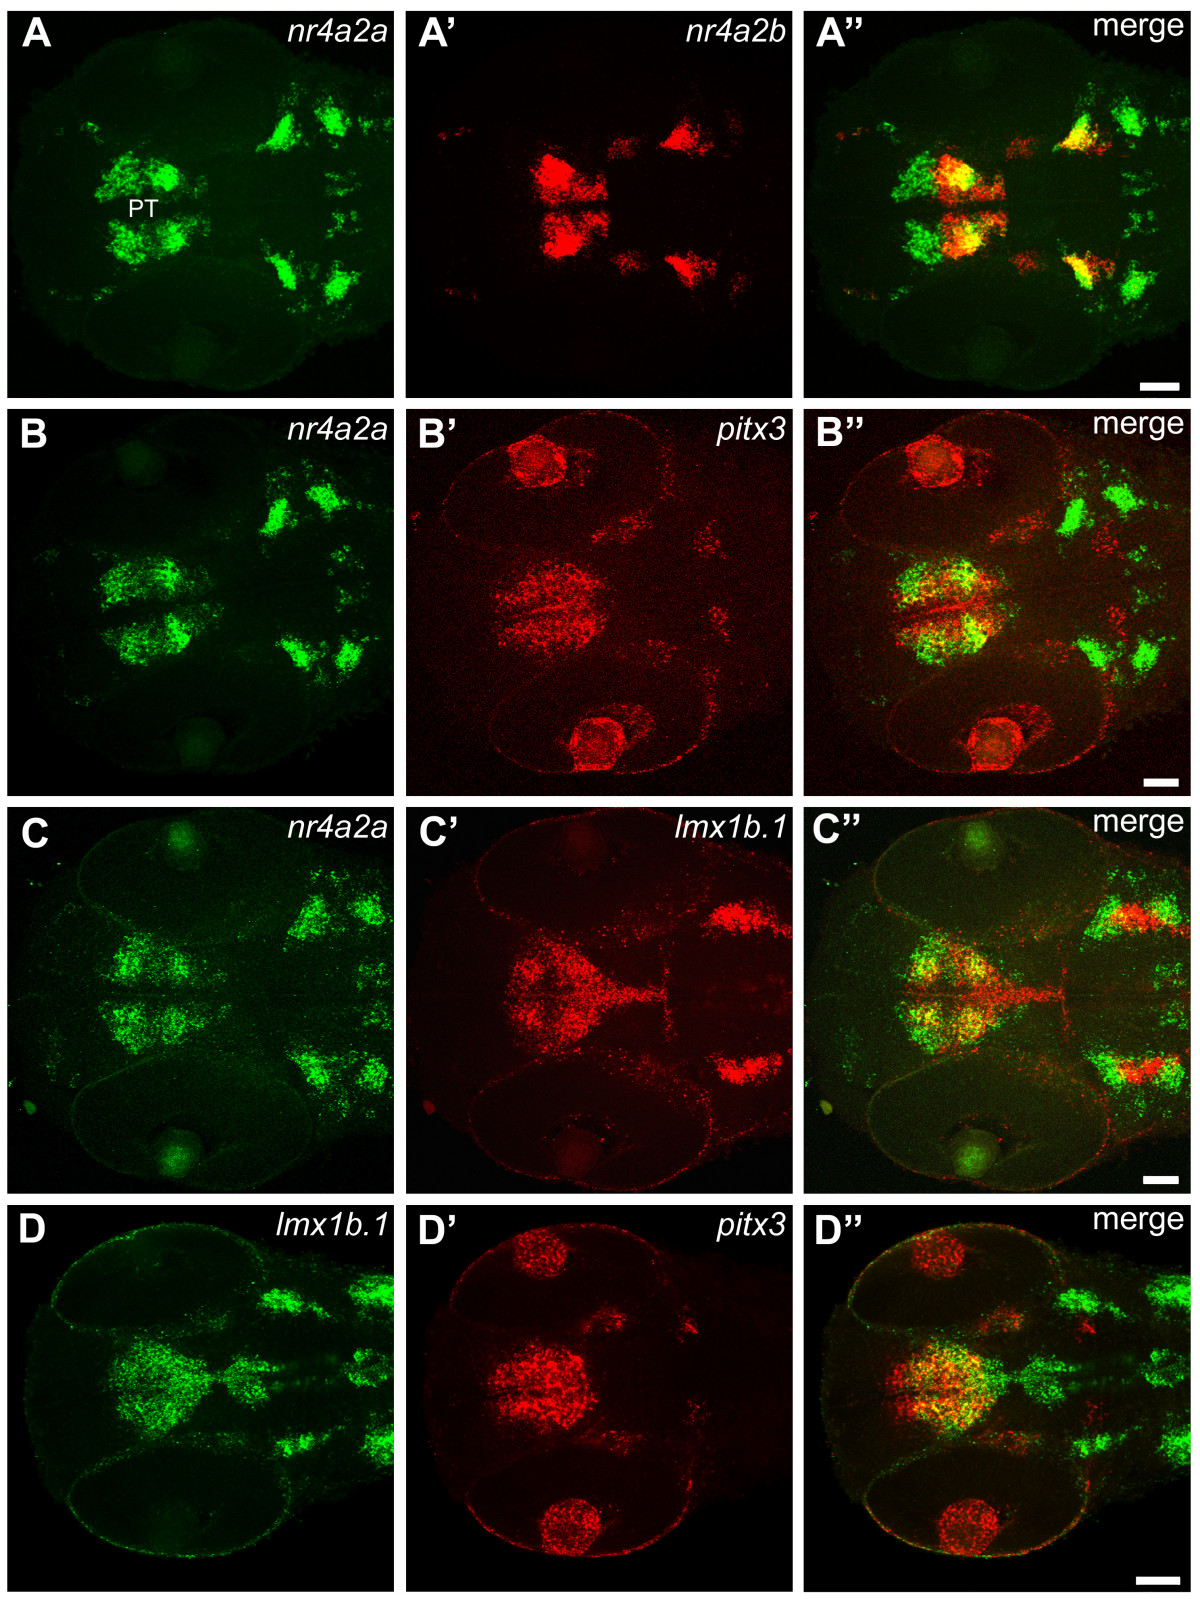
Fig. 3 Areas of co-expression between nr4a2a/b, pitx3 and lmx1b.1 in the posterior tuberculum. (A-D″) Confocal z-projections of double whole mount FISH at 48 hpf show overlapping expression domains for nr4a2a/b, pitx3 and lmx1b.1. The projections encompass the focal planes through the ventral diencephalon. The antisense probes used for the FISH are indicated on the top of each panel. (A-A″) 28 μm projection; (B-B″) 19 μm projection; (C-C″) 16 μm projection; (D-D″) 13 μm projection. Anterior is to the left. Scale bars: 50 μm. Abbreviation: PT, posterior tuberculum.
Figure Data
Acknowledgments
This image is the copyrighted work of the attributed author or publisher, and
ZFIN has permission only to display this image to its users.
Additional permissions should be obtained from the applicable author or publisher of the image.
Full text @ BMC Dev. Biol.