
|
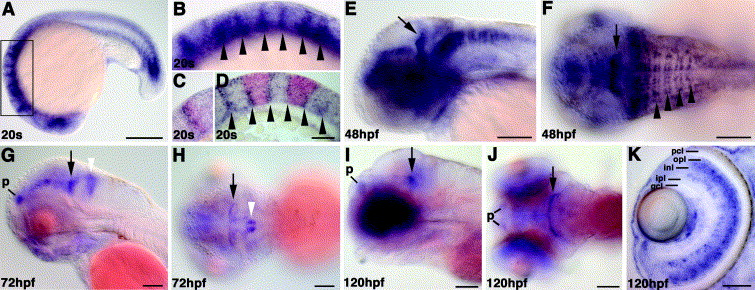
Fig. 4 Neural expression of rasgef1b during late embryogenesis and early larval stages. (A–D) rasgef1b expression in 20-somite stage embryo. The region in box (A) is shown in a higher magnification in (B). (C, D) Sagittal sections show overlapping expression of rasgef1b (blue) and pax2.1 (red) in the anterior part of the MHB (C) and expression along the rhombomere boundaries (indicated by black arrowheads in (B) and (D)) in embryos stained for rasgef1b (blue) and krox20 (red). (E, F) rasgef1b expression at 48 hpf in the ventral part of MHB (black arrow), in two stripes of cells adjacent to the rhombomere boundaries (black arrowheads mark the single rhombomere boundaries) and in the dorsal part of the rhombencephalon. At 72 hpf (G, H) and 120 hpf (I, J) rasgef1b expression is detectable in the pallium (p), MHB (black arrow) and the hindbrain (white arrowhead). (K) Cross section of the eye at 120 hpf embryo: expression of rasgef1b is mainly restricted to the inner nuclear layer (inl) and outer plexiform layer (opl). Indicated are photoreceptor layer (pcl), inner plexiform layer (ipl) and ganglion receptor layer (gcl). Embryos are shown from lateral (A, E, G, and I) or dorsal (F, H, and J) with anterior to the left. Scale bars: A, 200μm; D, K, 50μm; E–J, 100μm.
Reprinted from Gene expression patterns : GEP, 7(4), Epting, D., Vorwerk, S., Hageman, A., and Meyer, D., Expression of rasgef1b in zebrafish, 389-395, Copyright (2007) with permission from Elsevier. Full text @ Gene Expr. Patterns