
IMAGE
Fig. 5
Image
|
Figure Caption
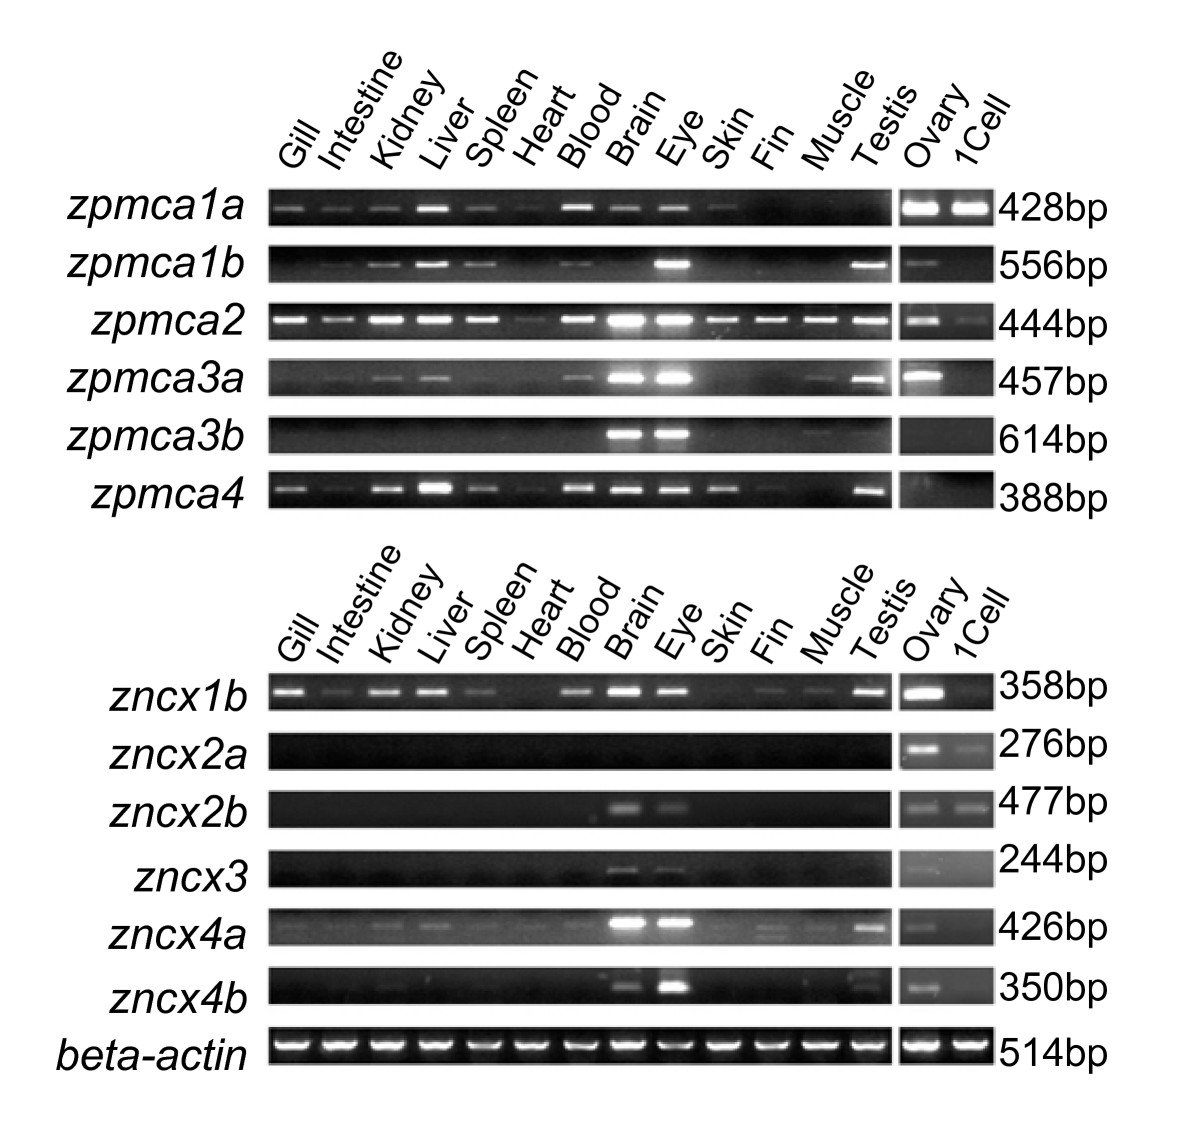
Fig. 5 Expression patterns of zebrafish plasma membrane Ca2+-ATPases (PMCAs) and Na+/Ca2+ exchangers (NCXs) in various tissues by RT-PCR analysis. The zebrafish beta-actin was used as internal control to evaluate the relative amounts of cDNAs. The expected amplicon sizes are shown on the right. 1Cell, cDNA from the 1-cell stage of zebrafish embryos.
Figure Data
Acknowledgments
This image is the copyrighted work of the attributed author or publisher, and
ZFIN has permission only to display this image to its users.
Additional permissions should be obtained from the applicable author or publisher of the image.
Full text @ BMC Genomics