
Image
|
Figure Caption
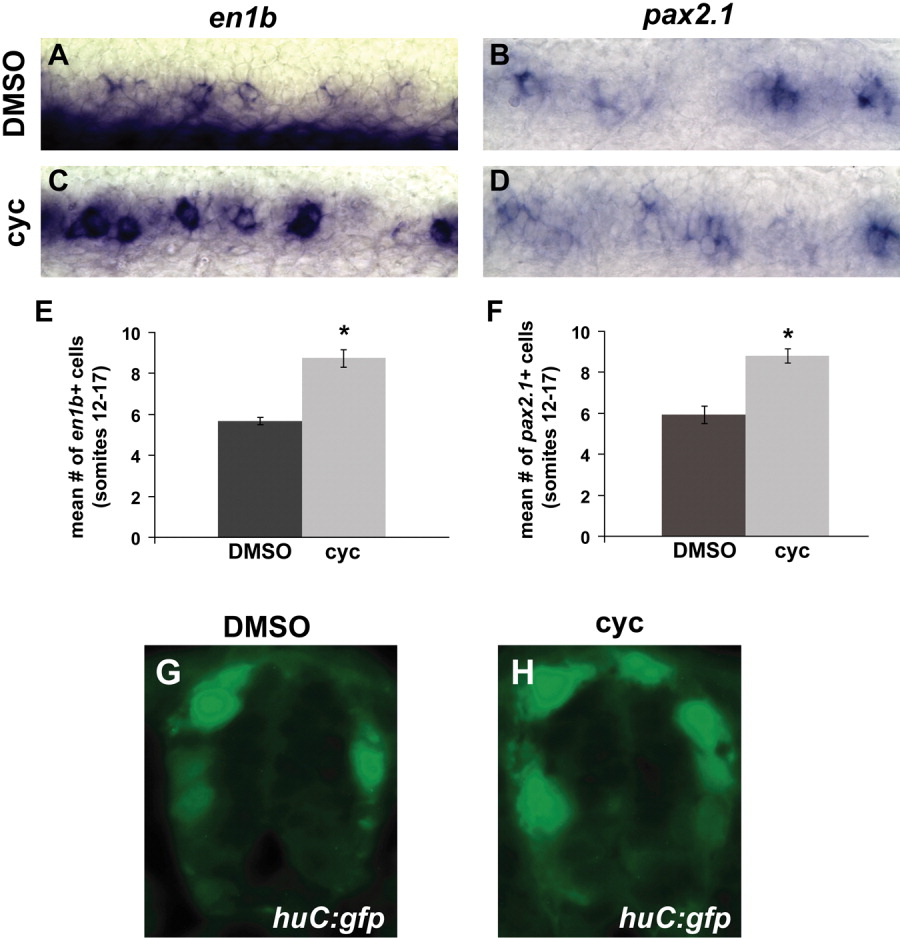
Fig. 4 en1b+ and evx1+ interneurons increase in cyclopamine-treated embryos. A-D: Lateral whole-mount views of subtype-specific postmitotic marker are shown with rostral to the left at 24 hours postfertilization (hpf). A-F: en1b+ (A,C,E) and pax2.1+ (B,D,F) interneurons are increased in cyclopamine-treated embryos. Error bars represent SEM. G,H: Representative sections of green fluorescent protein (GFP) expression in Tg(elavl3:EGFP)zf8 embryos are shown. There is no change in the number of Hu-positive neurons after cyclopamine treatment.
Figure Data
Acknowledgments
This image is the copyrighted work of the attributed author or publisher, and
ZFIN has permission only to display this image to its users.
Additional permissions should be obtained from the applicable author or publisher of the image.
Full text @ Dev. Dyn.