
|
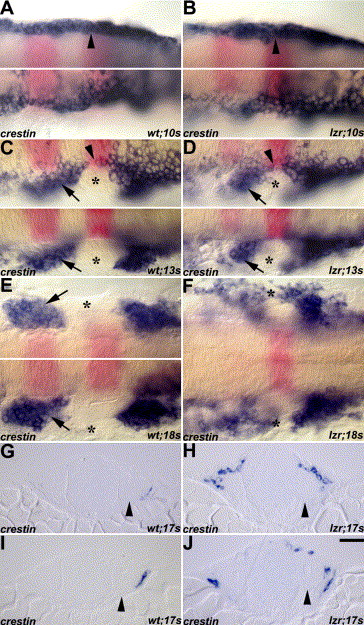
Fig. 1 Migrating cranial NCCs in wild-type (A, C, E, G, I) and lzr/pbx4 mutant (B, D, F, H, J) embryos revealed by crestin RNA in situ hybridization (blue). Flat-mount embryos are arranged with anterior to the left and krox20 (pink) indicates r3 and r5. Arrows indicate the second cranial NC stream in C–E. (A–B) Cranial NCCs (arrowheads) were observed as bilateral homogenous populations at the 10s stage both in the wild-type and lzr/pbx4 mutant embryos. (C–D) The separated cranial NCC streams and the cranial NC-free zone (asterisks) were observed at 13s stage both in wild-type and lzr/pbx4 mutant embryos. (E–F) The fusion of cranial NC streams in the periphery was observed at 18s stage in lzr/pbx4 mutants (asterisks in F), while the cranial NC-free zone was observed at the same stage of wild-type embryos (asterisk in E). The top and bottom panels in A, B, and E are different focal planes on both sides of the same embryo. (G–J) The distribution of cranial NCCs around the anterior OV (arrowheads) is shown in the two sequential cross sections of both the wild-type and lzr/pbx4 mutant embryos. G and H are the cross sections anterior to I and J, respectively. Scale bar: 20 µm in A–J.
Reprinted from Developmental Biology, 280(2), Yu, H.H., and Moens, C.B., Semaphorin signaling guides cranial neural crest cell migration in zebrafish, 373-385, Copyright (2005) with permission from Elsevier. Full text @ Dev. Biol.