
Fig. 11
|
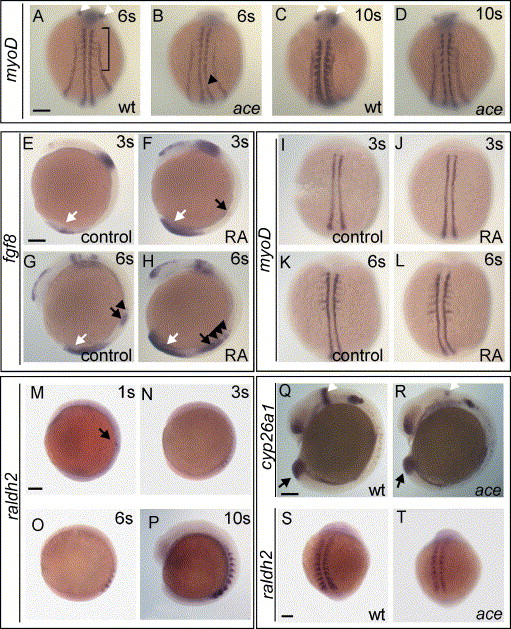
Fig. 11 Fgf8 controls expression of myoD in the lateral part of somites. Dorsal views of embryos, anterior to the top (A–D, I–L, S–T); lateral views (E–H, M–R). (A–D) Comparison of myoD expression in wt and ace embryos at 6- and 10-somite stages. Absence of pax2.1 expression in the otic placodes identifies ace embryos (white arrowheads), other areas of pax2.1 expression can be seen in intermediate mesoderm (unchanged in ace). (A, B) At the 6-somite stage, myoD expression in lateral parts of somites of wild-type embryos (brackets; A) is reduced in ace embryos as well as expression in adaxial cells (arrowhead; B). (C, D) At the 10-somite stage, myoD is strongly expressed in lateral parts of somites (C) and is reduced in ace embryos (D). (E–H) Induction timing of fgf8 by RA. At 3-somite stage, fgf8 is expressed in the tailbud (white arrow) in wild-types (E). In RA-treated embryos, fgf8 expression is induced in anterior psm (black arrow) and increased in tailbud (white arrow; F). (G, H) At the 6-somite stage, expression appears in anterior psm (black arrow) and somites (arrowhead) (G). Following RA treatment, expression in anterior psm (black arrow) and somites (arrowheads, H) is increased. (I–L) Timing of myoD-induction by RA. (I, J) At the 3-somite stage, myoD expression in adaxial cells is not modified by RA. (K, L) At the 6-somite stage, myoD expression expands in lateral part of somites. At this stage, myoD expression is not modified by RA. (M–P) raldh2 is expressed in somites from 1- to 10-somite stages. (Q–R) In wild-type and ace embryos, cyp26a1 is expressed in tailbud to a similar extent (black arrow). Reduction of pax2.1 expression in mhb was used to identify ace mutant (white arrowheads). (S–T) raldh2 expression at the 10-somite stage is reduced in somites of ace embryos (T) compared to wild-type (S). Scale bars: in panel A, 100 μm for panels A–D; in panel E, 100 μm for panels E–L; in panel M, 100 μm for panels M–P; in panel Q, 100 μm for panels Q–R; in panel S, 100 μm for panels S–T.
Reprinted from Developmental Biology, 289(1), Hamade, A., Deries, M., Begemann, G., Bally-Cuif, L., Genet, C., Sabatier, F., Bonnieu, A., and Cousin, X., Retinoic acid activates myogenesis in vivo through Fgf8 signalling, 127-140, Copyright (2006) with permission from Elsevier. Full text @ Dev. Biol.