
|
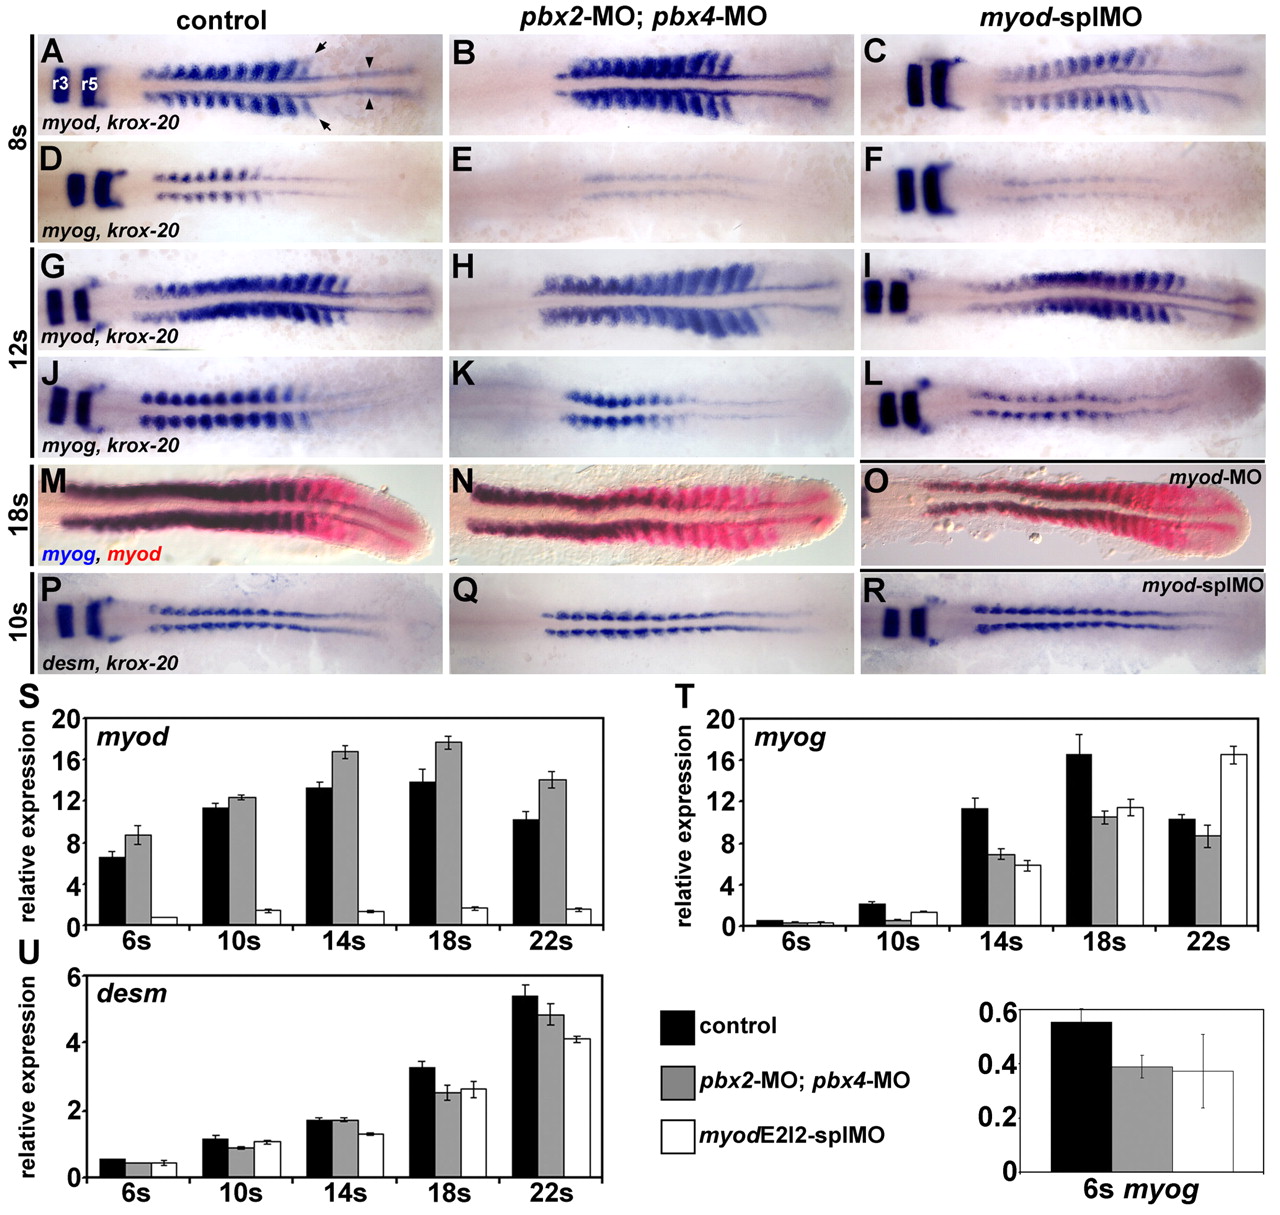
Fig. 1 Pbx and Myod are required for the proper initiation of myog expression. (A-R) RNA in situ expression of (A-C,G-I) myod and krox-20, (D-F,J-L) myog and krox-20, (M-O) myog (blue) and myod (red), or (P-R) desm and krox-20 in (A,D,G,J,M,P) wild-type control, (B,E,H,K,N,Q) pbx2-MO; pbx4-MO, (C,F,I,L,R) myod-splMO, or (O) myod-MO embryos. Similar phenotypes were observed for both myod splice-blocking MOs (myod-splMOs). Somite (s) staging was confirmed by counting somites using Nomarski optics. All embryos are shown in dorsal view, anterior towards the left. (A) Arrowheads point to adaxial cells; arrows point to lateral somite cells; and r3 and r5 indicate krox-20 expression in hindbrain rhombomeres. (S-U) Graphs of real-time reverse-transcriptase (RT)-PCR quantities for (S) myod, (T) myog and (U) desm. (T, bottom) Enlarged view of 6s stage myog expression and the key for S-U. x-axes are developmental stage and y-axes are relative mRNA expression level. Quantities were normalized to odc1 expression. Error bars represent standard deviation. myodE2I2-splMO targets the exon 2-intron 2 boundary (see Fig. S3 in the supplementary material). The myod real-time primers measure only mRNA with properly spliced intron 2. Quantitative (q)RT-PCR shows that less than about 10-15% of normally spliced myod transcripts remain in myod-splMO embryos (Fig. 1S and see Fig. S3 in the supplementary material; and data not shown). Similar quantities for myog and desmin were observed for both myod-splMOs.