
|
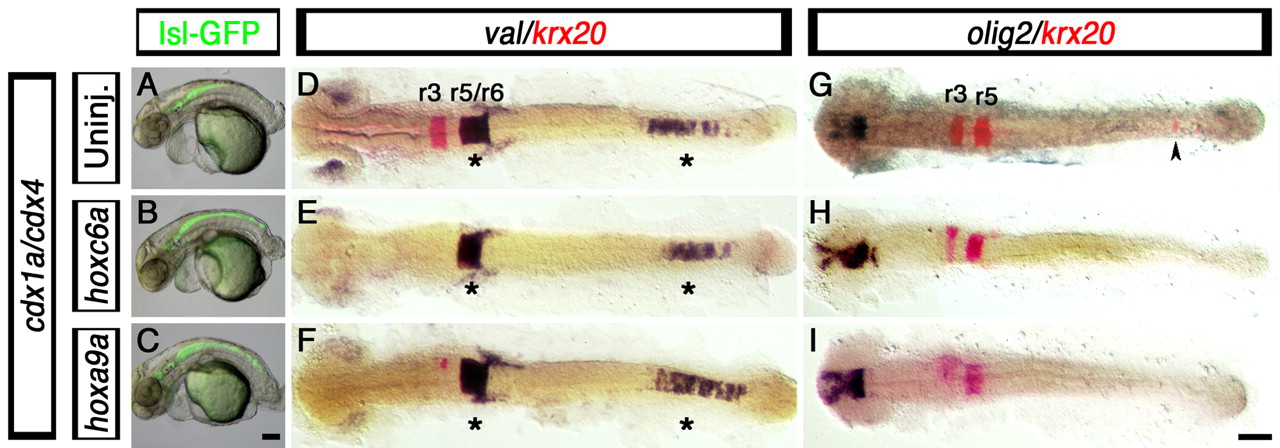
Fig. 7 Hindbrain and spinal cord defects associated with loss of Cdx function are not rescued by posterior Hox gene overexpression. (A-I) Branchial motor neuron distribution (A-C, GFP-positive cells), hindbrain markers krx20 (D-I, red) and val (D-F, purple), and spinal cord oligodendtrocyte marker olig2 (G-I, purple staining), in cdx1a/cdx4-deficient zebrafish embryos injected with 25 pg of hoxc6a and hoxa9a mRNA. (A-C) At 50 hpf, control and hoxc6a and hoxa9a mRNA-injected cdx1a/cdx4-deficient, isl1:GFP transgenic embryos show GFP-positive branchiomotor neurons throughout the posterior CNS. (D-I) At the 20-somite stage (19 hpf), hoxc6a and hoxa9a overexpression in cdx1a/cdx4-deficient embryos results in reduced krx20 expression in r3 and r5 and its loss in the posterior CNS (E,F,H,I, red; caudal expression indicated with an arrowhead), as compared with uninjected controls (D,G and Fig. 2). (D-F) val expression is maintained in r5/6 and posterior CNS of cdx1a/cdx4-deficient embryos overexpressing posterior Hox genes (see Fig. 2 for wild-type control). (G,I) Posterior Hox gene overexpression does not rescue spinal cord olig2 expression in cdx1a/cdx4-deficient embryos (see Fig. 1 for wild-type control). Embryos shown in lateral (A-C) or dorsal (D-I) views, anterior to the left. Asterisk indicates val expression in hindbrain and posterior CNS. Arrowhead indicates ectopic krx20 expression in the posterior CNS. A minimum of 15 embryos in three independent experiments were analyzed, with more than 90% of embryos displaying the phenotypes shown. Scale bars: 100 µm.