
Fig. 5
|
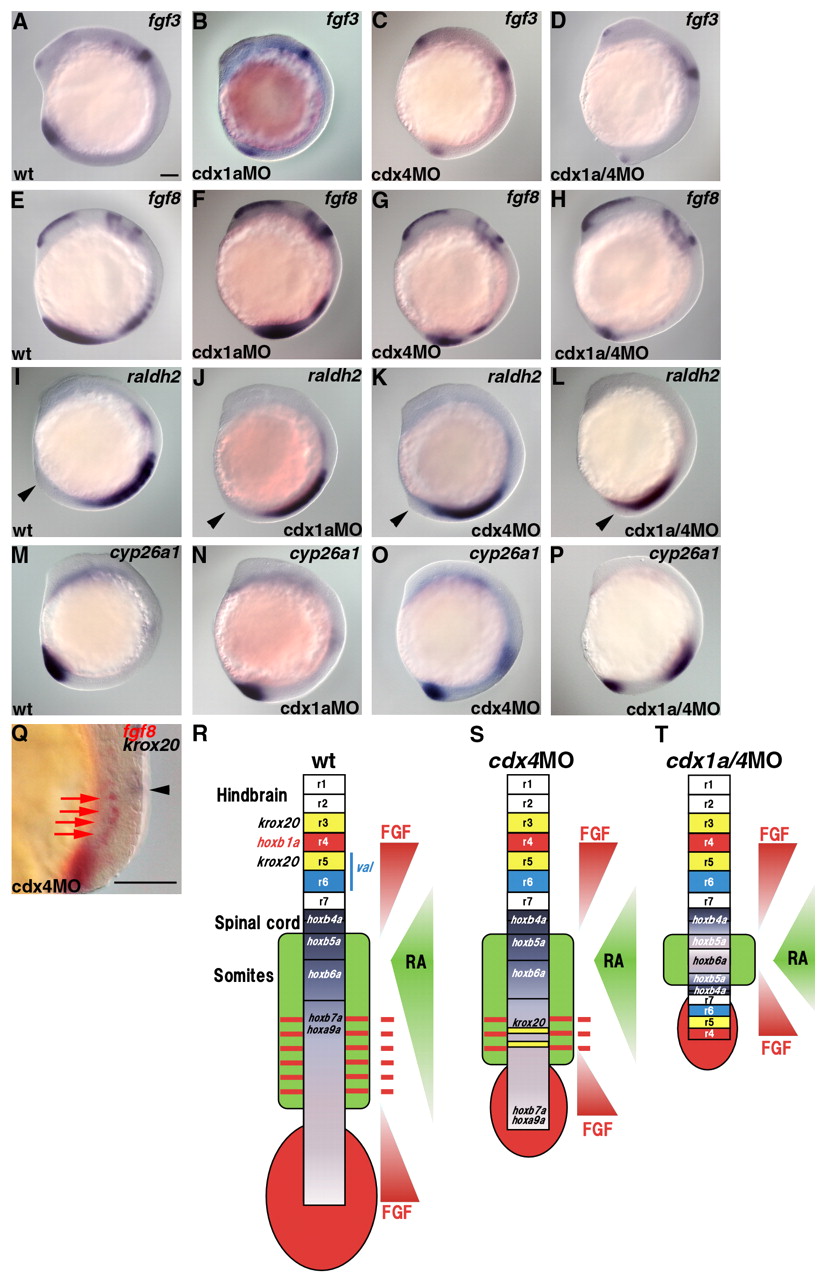
Fig. 5 Gradients of Fgf and RA signals. (A-P) Expression of fgf3 (A-D), fgf8 (E-H), raldh2 (I-L) and cyp26a1 (M-P) in wild-type control (A,E,I,M), cdx1a morphant (B,F,J,N), cdx4 morphant (C,G,K,O) and cdx1a/4 morphant (D,H,L,P) embryos at 13 hpf. The posterior end of the embryos are marked by arrowheads (I-L). (Q) Expression of fgf8 (red) and krox20 (purple) in the trunk region of cdx4 morphant embryos at 22 hpf. The ectopic krox20 in neural tissue and fgf8 in somitic mesoderm are marked by a black arrowhead and red arrows, respectively. (R-T) Schematic presentation of the Fgf and RA signaling gradients in wild-type (R), cdx4 morphant (S) and cdx1a/4 morphant (T) embryos. The expression domains of the fgfs and raldh2 are indicated in red and green, respectively, in the body of each schematic. The gradients of the Fgf and RA signals in the neuroectoderm are also indicated in red and green, respectively, and shown to the right of each schematic. The solid red bars on the right in R and S indicate stripes of Fgf signaling (see Q). Scale bars: 100 μm.