
Fig. 4
|
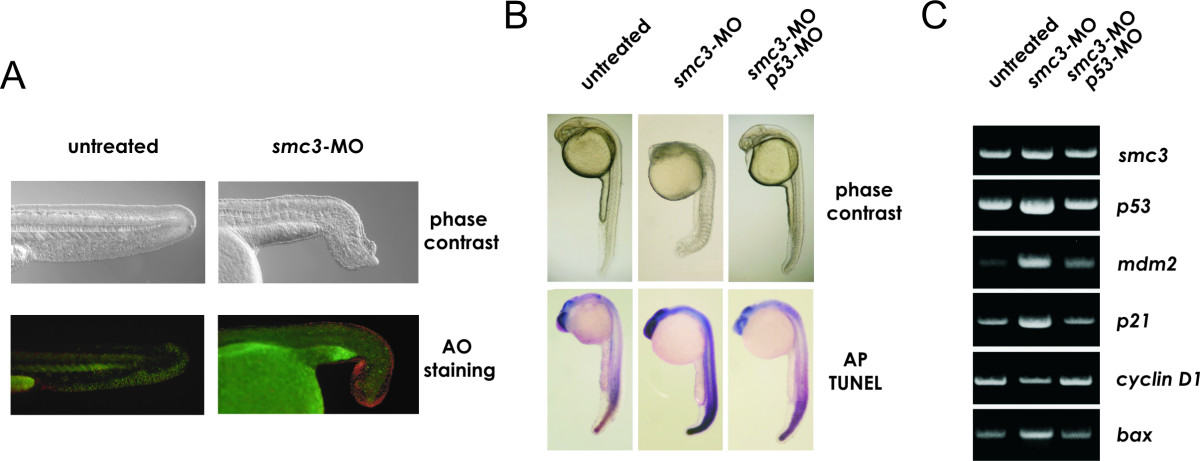
Fig. 4 p53 pathway activation and cell death following Smc3 knockdown. A) Acrydine Orange (AO) staining of apoptotic cells. Embryos at 1-2-two cell stage were injected with 1 nl of Danieau buffer (untreated group) or with 8 ng/embryo smc3-MO and at 24 hpf incubated in E3 medium containing 5 μg/ml of the fluorescent dye. Following 1 h incubation, the embryos were washed in PBS and observed under a fluorescence microscope. Note the high level of fluorescence signal at the terminal edge of the morphant's tail whereas in the untreated embryo fluorescence is only detected at the prospective vent. B) Morphological assessment and TUNEL immunostaining of apoptotic and dead cells in morphants. Embryos were injected at 1–2 cell-stage with MO to block translation of either smc3 only or of smc3 and p53, and examined at 28 hpf. C) Semi-quantitative RT-PCR of smc3, p53 and a p53-target genes transcript level in untreated embryos and in morphants at 24 hpf