
|
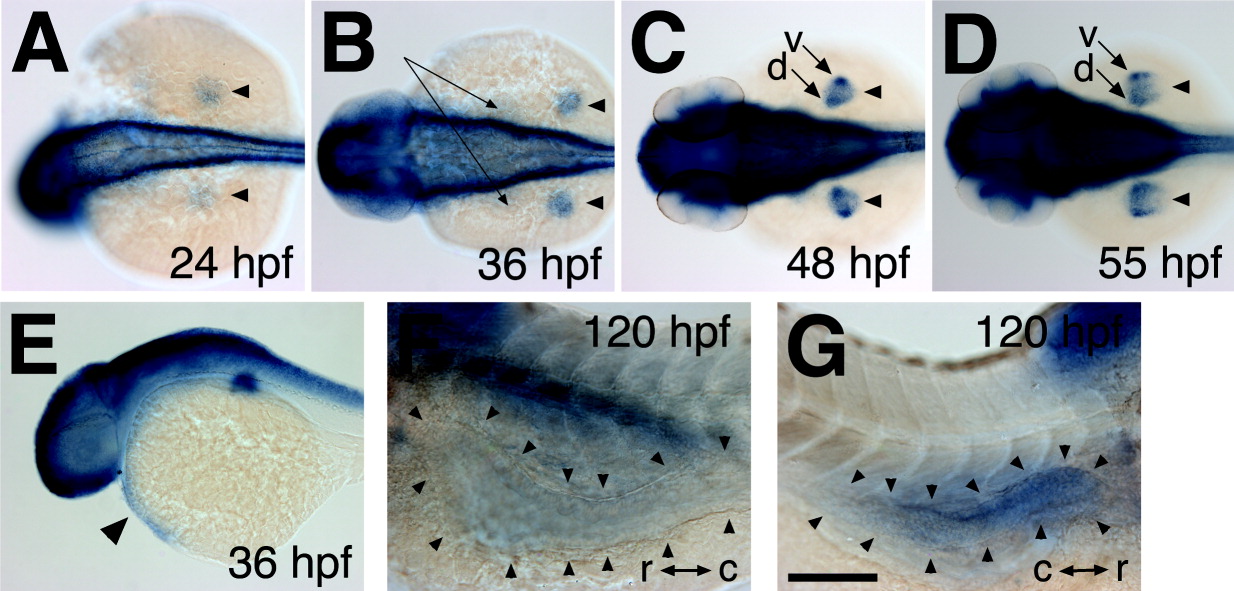
Fig. 5 dcc expression in non-neural tissues. A-D: Whereas dcc was found to be expressed uniformly in the mesenchyme of the fin bud at 24 and 36 hours postfertilization (hpf; arrowheads in A,B), it became more strongly expressed in the dorsal (d in C,D) and ventral (v in C,D) regions at 48 (C) and 55 (D) hpf. dcc was also expressed by cells located on the yolk sac anterior and medial to the fin bud (long arrows in B), presumably corresponding to the developing pronephros. E-G: Furthermore, dcc was expressed in the heart (arrowhead in E, 36 hpf), anterior to mid-intestine (arrowheads in F, 120 hpf, left side view), and pancreas (arrowheads in G, 120 hpf, right side view) during later stages of development. Dorsal views in A-D; lateral views in E-G. r, rostral; c, caudal. Scale bars = 200 μm in A-E, 100 μm in F,G.