
|
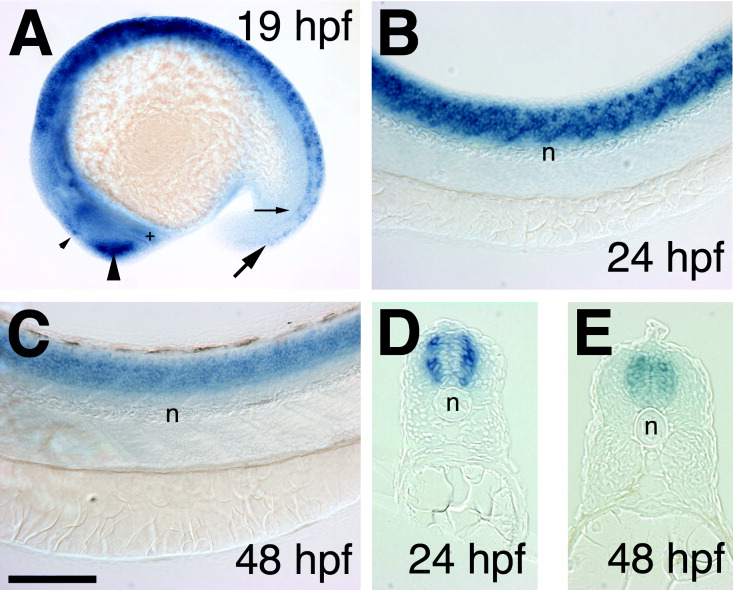
Fig. 2 A-E: Expression analysis of dcc in the spinal cord (SC) in whole-mounts (A-C) and transverse sections (D,E). A-C: Expression in the SC was at first patchy (A, 19 hours postfertilization [hpf] and B, 24 hpf) but became more uniform later in development (C, 48 hpf). D,E: Expression was first laterally restricted (D, 24 hpf) then spread more medially (E, 48 hpf). Note that the expression in the dorsal SC (thick arrow in A) reached further posterior than that in ventral SC (small arrow in A) at 19 hpf. Expression was also found in the epiphysis (small arrowhead in A), olfactory placode and bulb (large arrowhead in A), and in the ventrorostral neuronal cluster of the forebrain (+ in A) at 19 hpf. By 22 hpf, specific expression was also detected in the ventrocaudal neuronal cluster (not shown). Lateral views in A-C; transverse sections in D,E. Rostral is to the left, dorsal up in B and C. n, notochord. Scale bar = 200 μm in A, 100 μm in B,C, 50 μm in D,E.