
FIGURE 3
- ID
- ZDB-FIG-260731-19
- Publication
- Gurberg et al., 2026 - Impaired Motor Function in a Zebrafish Stathmin-2 Knockout Model
- Other Figures
- All Figure Page
- Back to All Figure Page
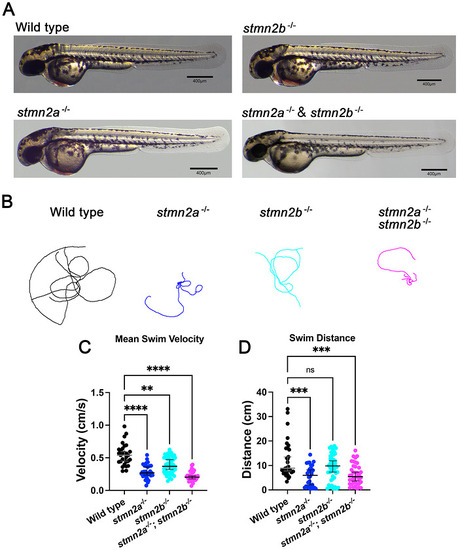
Two‐day old zebrafish touch‐evoked motor response assays for stmn2a−/−, stmn2b−/−, and double stmn2a−/−; stmn2b−/− fish. (A) Representative images of 2 dpf zebrafish. Scale bar represents 400 µm. (B) Five individual superimposed touch‐evoked motor traces from wild type, stmn2a−/−, stmn2b−/−, and double stmn2a−/−; stmn2b−/− genetic groups. (C) Mean swim velocity ± standard error and sample sizes were as follows: wild type (0.55 ± 0.03 cm/s, n = 30); stmn2a−/− (0.9 ± 0.02 cm/s, n = 30); stmn2b−/− (0.39 ± 0.02 cm/s, n = 45); and double stmn2a−/− and stmn2b−/− (0.22 ± 0.01 cm/s, n = 39). Statistical differences were as follows: wild type versus stmn2a−/−, p < 0.0001; wild type versus stmn2b−/−, p = 0.004; wild type versus double stmn2a−/− and stmn2b−/−, p < 0.0001. (D) Mean swim distance ± standard error and sample sizes were as follows: wild type (12.4 ± 1.4 cm, n = 30); stmn2a−/− (5.7 ± 0.8 cm, n = 30); stmn2b−/− (9.3 ± 0.8 cm, n = 45); double stmn2a−/− and stmn2b−/− (6.3 ± 0.7 cm, n = 39). Statistical differences were as follows: wild type versus stmn2a−/−, p = 0.0006; wild type versus double stmn2a−/− and stmn2b−/−, p = 0.0009. Data points in (C) and (D) represent individual zebrafish measurements with black/grey bars representing the overall group mean ± standard error. Kruskal–Wallis multiple comparisons tests were used to determine significance. *p < 0.05, **p < 0.01, and ***p < 0.001 and ****p < 0.0001. |
| Fish: | |
|---|---|
| Observed In: | |
| Stage: | Long-pec |