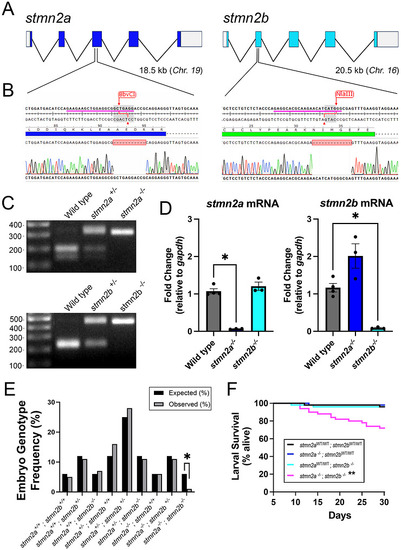
Development of the stmn2a and stmn2b KO zebrafish lines. (A) Schematic representation of zebrafish stmn2a and stmn2b genes showing gene structure. (B) Location of guide RNAs (pink lines) for each gene and mutant lines selected for use. An 11‐nucleotide deletion and a 13‐nucleotide deletion were produced in stmn2a and stmn2b, respectively, resulting in premature stop codons in the open reading frame. (C) Loss of BbvCI (stmn2a) and NlaIII (stmn2b) restriction enzyme digestion sites at their respective gRNA target sites was used for genotyping of digested amplicons. (D) Analysis of gene expression using RT‐qPCR of cDNA derived from RNA collected from 2 dpf zebrafish. Expression levels are relative to gapdh. A significant reduction in stmn2a expression in stmn2a−/− zebrafish (p < 0.05) and a significant reduction in stmn2b in stmn2b−/− fish (p < 0.05) were observed, suggesting the mutant transcripts are targeted for nonsense‐mediated decay. No stmn2a compensation was observed in the stmn2b−/− fish, whereas a trend (p = 0.11) towards stmn2b compensation in stmn2a−/− fish was observed. Statistical analysis was performed by Mann–Whitney tests, and significance determined at p < 0.05. Sample sizes: wild type, N = 4 batches of 30 pooled embryos; stmn2a−/−, N = 3; stmn2b−/−, N = 3. (E) A significant reduction in the expected frequency of double stmn2a−/−; stmn2b−/− 2 dpf embryos was identified following a stmn2a+/−; stmn2b± × stmn2a+/−; stmn2b± incross when compared to the expected frequency (chi‐squared test, p = 0.003). (F) Survival curve showing a reduction in stmn2a−/−; stmn2b−/− zebrafish survival between 5 and 30 days of development in comparison to wild type (chi‐square test, p = 0.0011), n = 50 larvae for each group *p < 0.05, **p < 0.01.
|
