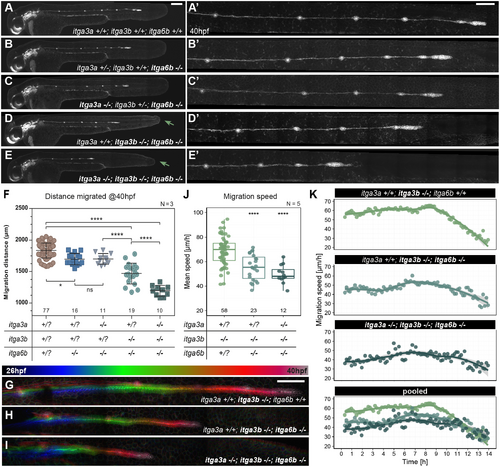
itga3a, itga3b and itga6b compensate for each other to mediate pLLP migration. (A-E′) Integrin compound mutants at 40 hpf (A-E) and higher magnifications of the pLL (A′-E′). Green arrows indicate the badfin phenotype in itga3b;6b double (D) and itga3a;3b;6b triple (E) mutants. (F) Quantification of pLLP migration distance reveals significant delays in double and triple mutants. Full panel and quantification of triple mutant combinations are in Fig. S4. (G-K) Temporally color-coded maximum-intensity projections of 14 h time-lapse (G-I) with quantification of (J) average speed and (K) loess model of instantaneous speed with mean values per time point. (F) One-way ANOVA with multiple comparisons (each dot represents data from one embryo; data are mean±s.d.). (J) Two-tailed Wilcoxon rank-sum test [each dot represents data from one embryo; boxes indicate the median and interquartile range (IQR); whiskers indicate 1.5×IQR]. ns, non-significant; *P<0.05; ****P<0.0001. Sample sizes (n) are indicated above the x-axes. N, number of biological replicates. Scale bars: 200 μm in A-E,G-I; 100 μm in A′-E′.
|
