|
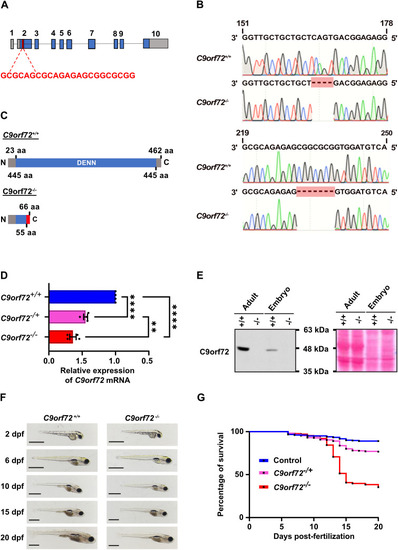
Generation and validation of a stable zebrafish C9orf72 knockout line. (A) Schematic representation of the CRISPR/Cas9-mediated knockout of the endogenous C9orf72 gene. A guide RNA was designed to target the start codon region in the second exon of C9orf72, inducing indels. (B) Sequencing of the C9orf72 knockout line revealed two distinct deletions (Δ4 and Δ7) at different sites within the C9orf72 sequence, resulting in a total deletion of 11 base pairs that was absent in C9orf72+/+ wild-type specimens. (C) Schematic representation of the predicted truncated C9orf72 protein resulting from the frameshift caused by the Δ4 and Δ7 deletions. Amino acids (aa). (D) Quantitative analysis of C9orf72 mRNA expression at 2 days post-fertilization (dpf) demonstrated significantly reduced transcript levels in C9orf72-/+ and C9orf72-/- compared to C9orf72+/+ controls, with C9orf72-/- showing significantly lower levels than C9orf72-/+. Data are presented as mean ± SEM, normalized to Polr2d mRNA levels. Ordinary one-way ANOVA with Holm-Šídák#39;s multiple comparisons post-hoc test; **** p < 0.0001, ** p ≤ 0.01 N = 4 experimental repeats, n = 3 technical replicates. (E) Immunoblotting and Ponceau staining confirmed the absence of C9orf72 protein in C9orf72-/-(-/-) adults and 2 dpf embryos. C9orf72+/+ (+/+) specimens served as controls for the presence of the protein. (F) Comparative morphological analysis revealed no apparent defects in C9orf72-/- compared to C9orf72+/+ controls. (G) Kaplan–Meier survival analysis up to 20 dpf showed significantly reduced survival in C9orf72-/+ and C9orf72-/- compared to C9orf72+/+ controls after 10 dpf, with C9orf72-/- exhibiting significantly lower survival than C9orf72-/+ after 13 dpf. Log-rank (Mantel-Cox) test; N = 3 experimental repeats, n = 300 total fish per genotype. Scale bars = 1 mm.
|