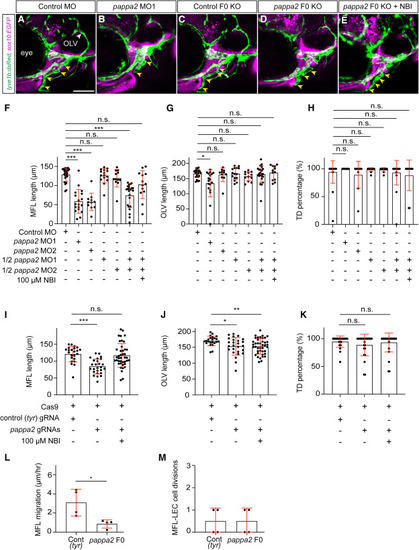
Genetic disruption of pappa2 inhibits MFL development (A–E) Confocal images of the lyve1b:dsRed (green) sox10:EGFP (magenta) zebrafish head at 6 dpf that were injected at the one-cell stage with 1 pmol of control MO (A), 0.75 pmol of pappa2 MO 1 (B), Cas9 protein with control (tyr) gRNA (C), Cas9 protein with pappa2 gRNAs (D), and Cas9 protein with pappa2 gRNAs and 100 μM NBI (E). Yellow arrowheads highlight the MFL. (F–H) Quantification of the length of the MFL (F), the length of OLV (G), and the formation of TD (H) at 6 dpf, comparing the control morphants (n = 25) with morphants injected with 0.75 pmol of pappa2 MO 1 (n = 18), 1 pmol of pappa2 MO 2 (n = 11), 0.38 pmol of pappa2 MO 1 (n = 15), 0.5 pmol of pappa2 MO 2 (n = 12), morphants co-injected with 0.38 pmol of pappa2 MO 1 and 0.5 pmol of pappa2 MO 2 (n = 23), and co-injected morphants treated with NBI at 4 dpf (n = 13). (I–K) Quantification of the length of the MFL (I), the length of OLV (J), and the formation of TD (K) at 6 dpf, comparing the control (tyr) crispants (n = 23), pappa2 crispants (n = 26), and pappa2 crispants treated with NBI at 4 dpf (n = 41). (L and M) Quantification of MFL migration speed (L) and the number of MFL-LEC divisions from 4 to 5 dpf (M). Data taken from 16- to 24-h time-lapse imaging experiments initiated at 4 dpf comparing control (tyr) crispants (n = 4) and pappa2 crispants (n = 4). OLV, otolithic lymphatic vessel; TD, thoracic duct. Scale bars: 50 μm. Data represent mean ± SD; ∗∗∗p < 0.001; ∗p < 0.05; ns, p > 0.05 from one-way ANOVA with Dunnett’s multiple comparison tests for the assessment of significance.
|
