
FIGURE
FIGURE 2
- ID
- ZDB-FIG-260129-36
- Publication
- Han et al., 2026 - Multiple susceptibility enhancer variants increasing ADD3 expression predisposes to biliary atresia risk
- Other Figures
- All Figure Page
- Back to All Figure Page
FIGURE 2
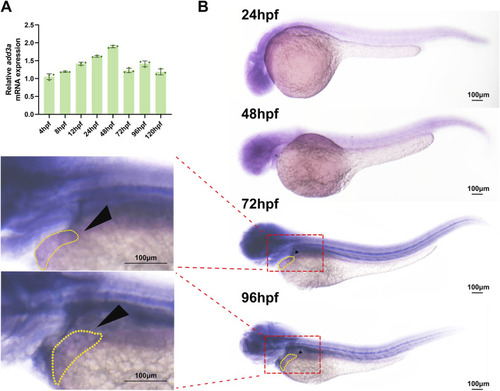
Spatiotemporal expression patterns of |
Expression Data
| Gene: | |
|---|---|
| Fish: | |
| Anatomical Terms: | |
| Stage Range: | Sphere to Day 5 |
Expression Detail
Antibody Labeling
Phenotype Data
Phenotype Detail
Acknowledgments
This image is the copyrighted work of the attributed author or publisher, and
ZFIN has permission only to display this image to its users.
Additional permissions should be obtained from the applicable author or publisher of the image.
Full text @ Front Genet