|
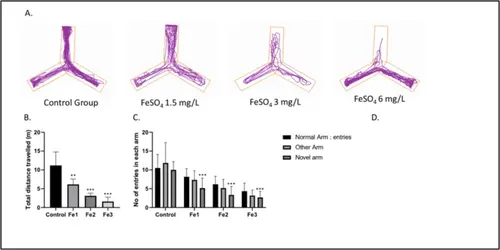
Ferrous Sulphate (1.5, 3, and 6 mg/L) impaired the locomotion pattern and memory in the Y maze test (A) Illustration of representative locomotion tracking pattern of the Control group and FeSO4 (1.5, 3, and 6 mg/L) treated groups. Here, 1: Start Arm; 2: Other Arm and; 3: Novel Arm (B) Graphical representation of the total distance travelled in different groups. (C) Graphical representation of the No. of entries of the zebrafish in each arm (Normal arm (start arm), Other arm and Novel arm. Data are represented as means ± S.E.M. (n = 10). For Bonferroni’s post hoc analyses: (B) Control vs. Fe1(1.5 mg/L): ** p < 0.001, Control vs. Fe2(3 mg/L): *** p < 0.0001, Control vs. Fe3(6 mg/L): *** p < 0.0001. (C) For Novel arm: Control vs. Fe1(1.5 mg/L): *** p < 0.0001, Control vs. Fe2(3 mg/L): *** p < 0.0001, Control vs. Fe3(6 mg/L): *** p < 0.0001. (D) Control vs. Fe1(1.5 mg/L): *** p < 0.0001, Control vs. Fe2(3 mg/L): *** p < 0.0001, Control vs. Fe3(6 mg/L): *** p < 0.0001
|