
Fig. 3
- ID
- ZDB-FIG-250602-42
- Publication
- Chen et al., 2025 - DDX24 spatiotemporally orchestrates VEGF and Wnt signaling during developmental angiogenesis
- Other Figures
- All Figure Page
- Back to All Figure Page
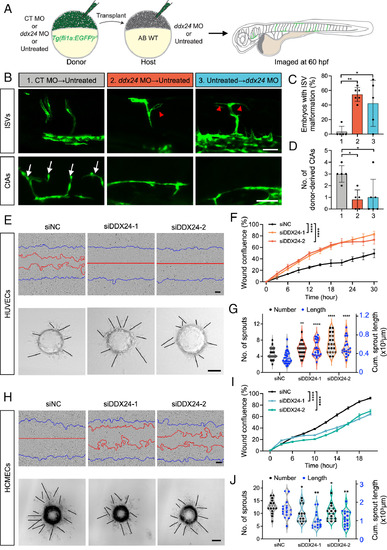
DDX24 regulates developmental angiogenesis both EC-autonomously and nonautonomously. (A) Schematic diagram of the embryonic transplantation experiment to evaluate the cell-autonomous role of DDX24 in angiogenesis. (B) Representative confocal images of mosaic ISVs and CtAs at 60 hpf. Red arrowheads indicate ectopic ISV branches; white arrows indicate CtAs. (C) Quantification of ectopic branching in EGFP-labeled ISVs from transplanted embryos. n = 26, 22, 19 embryos from 5 or 6 experiments. (D) Quantification of donor-derived CtAs in transplanted embryos. n = 5, 5, 6 CtAs. 1, CT MO → Untreated; 2, ddx24 MO → Untreated; 3, Untreated → ddx24 MO. (E) Representative brightfield images of wound healing assays (Top panels) and 3D sprouting assays (Bottom panels) in HUVECs transfected for 36 h with DDX24 siRNA (siDDX24) or control siRNA (siNC). Blue lines indicate the initial scratch wound outlines and red lines indicate the scratch wound outlines at 18 h post scratch. (F) Quantification of wound healing assays in HUVECs. (G) Quantification of the number and length of sprouts in HUVECs. n = 34, 25, 20 beads from three experiments. (H) Representative brightfield images of wound healing assays (Top panels) and 3D sprouting assays (Bottom panels) in HCMECs transfected for 36 h with DDX24 siRNA (siDDX24) or control siRNA (siNC). The blue lines indicate the initial scratch wound outlines, the red lines indicate the scratch wound outlines at 16 h after the scratching. (I) Quantification of wound healing assays in HCMECs. (J) Quantification of the number and length of sprouts in HCMECs. n = 17, 15, 17 beads from three experiments. [Scale bars, 50 μm in (B), 100 μm in (E and H).] Data are represented as mean ± SD. *P < 0.05, **P < 0.01 and ****P < 0.0001, as assessed by one-way ANOVA (C, G-length, J-length), nonparametric Kruskal–Wallis test (D, G-number, J-number), and two-way ANOVA (F and I). |