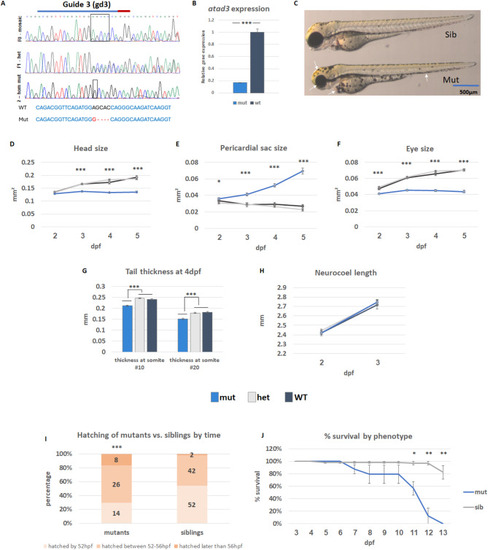
Characterization of atad3-null embryos/larvae. (A) DNA extracted from mutant embryos confirmed a homozygous out-of-frame deletion (upper panel– F0 generation, mosaic; middle panel– F1 generation, heterozygous; lower panel– F2 homozygous mutant). CRISPR RNA (crRNA) marked by a blue line, PAM sequence marked by a red line. Sequences below show overall 4 bp frameshift caused by 5 bp deletion and 1 bp insertion in the mutant as compared to wild-type (WT). (B) Reduced atad3 expression in mutant embryos. (C) Representative images of healthy sibling and mutant embryos (gd3). 35 such embryos (6 WT, 12 heterozygous, 17 mutant) were photographed throughout ages 2–5 dpf and measured (dark grey– WT; light grey– heterozygous, blue– knockout embryos). Mutant embryos showed smaller head size (D), pericardial edema (E), smaller eyes (F), and decreased tail thickness (G) despite comparable neurocoel length (H). Error bars indicate standard error of means. (I) Hatching time-range for 96 siblings and 48 mutants (X2 (1, N = 144) = 14.9, p = 0.000582, indicated above the mutant bar). (J) Percent of larvae survival by day, according to phenotype: Mutants in blue (23 total, 7–8 in each biological replicate) and siblings in grey (66 total, 21–23 in each biological replicate). Error bars indicate the standard error of means of three biological replicates. Asterisks represent levels of significance (*p < 0.05, **p < 0.01, ***p < 0.001)
|

