FIGURE SUMMARY
Title

Transcriptome analysis of atad3-null zebrafish embryos elucidates possible disease mechanisms

Authors
Ezer, S., Ronin, N., Yanovsky-Dagan, S., Rotem-Bamberger, S., Halstuk, O., Wexler, Y., Ben-Moshe, Z., Plaschkes, I., Benyamini, H., Saada, A., Inbal, A., Harel, T.
Source
Full text @ Orphanet J Rare Dis

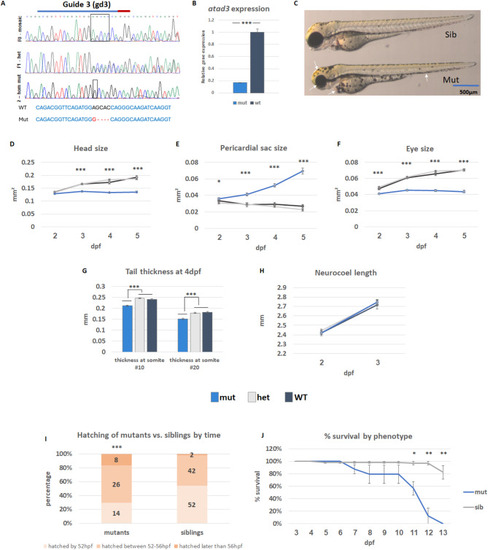
Characterization of atad3-null embryos/larvae. (A) DNA extracted from mutant embryos confirmed a homozygous out-of-frame deletion (upper panel– F0 generation, mosaic; middle panel– F1 generation, heterozygous; lower panel– F2 homozygous mutant). CRISPR RNA (crRNA) marked by a blue line, PAM sequence marked by a red line. Sequences below show overall 4 bp frameshift caused by 5 bp deletion and 1 bp insertion in the mutant as compared to wild-type (WT). (B) Reduced atad3 expression in mutant embryos. (C) Representative images of healthy sibling and mutant embryos (gd3). 35 such embryos (6 WT, 12 heterozygous, 17 mutant) were photographed throughout ages 2–5 dpf and measured (dark grey– WT; light grey– heterozygous, blue– knockout embryos). Mutant embryos showed smaller head size (D), pericardial edema (E), smaller eyes (F), and decreased tail thickness (G) despite comparable neurocoel length (H). Error bars indicate standard error of means. (I) Hatching time-range for 96 siblings and 48 mutants (X2 (1, N = 144) = 14.9, p = 0.000582, indicated above the mutant bar). (J) Percent of larvae survival by day, according to phenotype: Mutants in blue (23 total, 7–8 in each biological replicate) and siblings in grey (66 total, 21–23 in each biological replicate). Error bars indicate the standard error of means of three biological replicates. Asterisks represent levels of significance (*p < 0.05, **p < 0.01, ***p < 0.001)

Mitochondrial characterization and ATP content of atad3-null larvae. Mutants in blue, siblings in grey. (A) mtDNA content comparison between pools of mutant embryos and their healthy siblings (5 dpf); 3 biological replicates of pools (3–8 mutants each, 6–11 siblings each). (B) ATP content in the heads of 6 dpf embryos, relative to average sib ATP content measured on the same day; four biological replicates, two from each day. 3 heads in each sample. (C) Enzymatic activity of COX and complex II + III normalized to SDH activity relative to the average enzymatic activity of siblings. Measured from 3 biological replicates, 7–9 heads of 5 dpf larvae in each sample. Error bars indicate standard error of means. Asterisks represent levels of significance (*p < 0.05, **p < 0.01, ***p < 0.001)

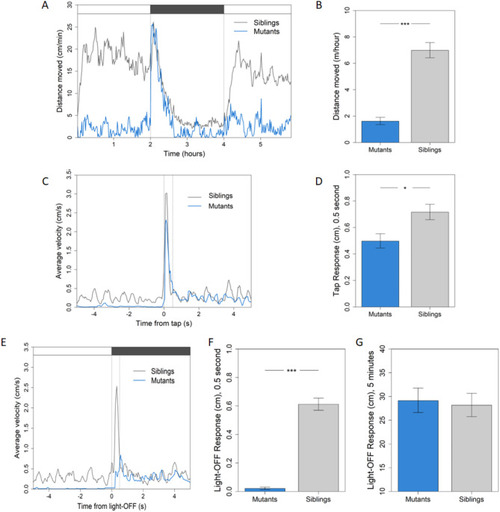
Locomotor activity of atad3-null larvae at 5 dpf and 6 dpf is reduced. Mutants in blue, siblings in grey. (A) Activity over time at 5 dpf: average distance moved per minute over 6 h (light-dark-light cycle, 2 h each). Upper panel indicates light/dark conditions. (B) Mutants demonstrate reduced activity, as measured by average distance moved over 6 h (p < 0.001). (C) Response to tap in mutants compared to siblings, average of 5 and 6 dpf. Average velocity of mutant larvae immediately after tap (0 s on the X axis) is lower than siblings. (D) Average distance moved in the first 0.5 s following tap is 1.4-times lower in mutant larvae compared to siblings (p = 0.012). (E) Average velocity before and after light-off. (F) Initial light-off response: average distance in the first 0.5 s following light-off is reduced in mutants (p < 0.001). (G) Average distance moved over 5 min after light-off switch shows no difference between mutant and sibling activity (p = 0.67). Asterisks represent levels of significance (*p < 0.05, **p < 0.01, ***p < 0.001)

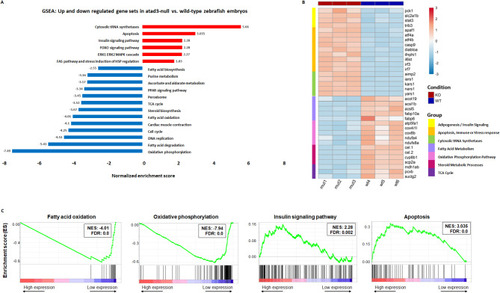
RNA-seq comparing mut 3 dpf embryos to their WT siblings. (A) Selected pathways that were downregulated (blue) or upregulated (red) in the atad3-null embryos compared to WT. (B) Heat-map representing the expression of selected genes from selected gene groups in WT vs. mutant embryo pools. (C) Selected GSEA plots showing gene sets that are downregulated or upregulated in KO vs. control. NES: normalized enrichment score; FDR: false discovery rate (corrected p value)

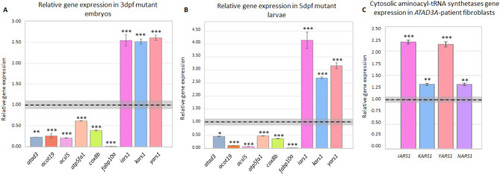
RT-qPCR validations for RNA-seq results. (A, B) RT-qPCR validation of differential expression by major gene groups: (A) at 3dpf. Gene expression in a pool of 20 mutants is normalized to gapdh and relative to expression in a pool of 15 siblings, marked by a black dashed line, with siblings average standard error of means of 3 technical replicates in grey. Error bars indicate mutant pool’s standard error of means of 3 technical replicates. (B) at 5dpf. Gene expression in a pool of 9 mutants is normalized to gapdh and relative to expression in a pool of 9 WT siblings, marked by a black dashed line, with WT average standard error of means of 3 technical replicates in grey. Error bars indicate mutant pool’s standard error of means of 3 technical replicates. (C) aaRS genes upregulated in fibroblasts derived from an individual with the monoallelic, dominant negative ATAD3A variant. Gene expression is normalized to GAPDH and relative to expression in control fibroblasts (marked by a black line), with the average standard error of means of 3 technical replicates in grey. Error bars indicate standard error of means in 3 technical replicates of affected fibroblasts. Asterisks represent levels of significance (*p < 0.05, **p < 0.01, ***p < 0.001).

Acknowledgments
This image is the copyrighted work of the attributed author or publisher, and ZFIN has permission only to display this image to its users. Additional permissions should be obtained from the applicable author or publisher of the image. Full text @ Orphanet J Rare Dis