
Fig. 7
- ID
- ZDB-FIG-250416-93
- Publication
- Jia et al., 2025 - Activation of prep expression by Tet2 promotes the proliferation of bipotential progenitor cells during liver regeneration
- Other Figures
- All Figure Page
- Back to All Figure Page
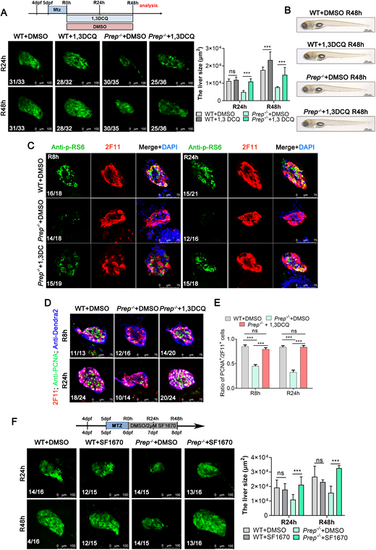
Prep activates the PI3K-Akt-mTOR signaling pathway. (A) Top panel: experimental scheme illustrating the pattern of DMSO and 1,3-DCQ added at R0h-R48h. Bottom panel: confocal microscope projection images showing the size of the regenerating livers from the WT+DMSO, WT+1,3-DCQ, Prep−/−+DMSO and Prep−/−+1,3-DCQ groups at R24h and R48h. The observed green fluorescence is derived from the Denra2 fluorescent protein, specifically labeling the liver of zebrafish. Right panel: Area of fluorescence statistics of Dendra2. (B) Brightfield and epifluorescence merged images showing the body phenotypes of the WT+DMSO, WT+1,3-DCQ, Prep−/−+DMSO and Prep−/−+1,3-DCQ groups at R48h. (C) Single-section confocal microscope images showing anti-p-RS6 and anti-2F11 antibody staining of the regenerated livers from the WT+DMSO, WT+1,3-DCQ, Prep−/−+DMSO and Prep−/−+1,3-DCQ groups at R8h and R24h. (D) Single-section confocal microscope images showing anti-2F11, anti-PCNA and anti-Dendra2 antibody staining of the regenerated livers from the WT+DMSO, WT+1,3-DCQ, Prep−/−+DMSO and Prep−/−+1,3-DCQ groups at R8h and R24h. (E) Ratio of PCNA+ cells to 2F11+ cells in regenerated livers from D. (F) Top panel: experimental scheme illustrating the pattern of DMSO and SF1670 added at R0h-R48h. Bottom panel: confocal microscope projection images showing the size of the regenerating livers from the WT+DMSO, WT+SF1670, Prep−/−+DMSO and Prep−/−+SF1670 groups at R24h and R48h. The observed green fluorescence is derived from the Denra2 fluorescent protein, specifically labeling the liver of zebrafish. Right panel: Area of fluorescence statistics of Dendra2. ns, not significant; ***P<0.001 (two-tailed post hoc test). Data are mean±s.e.m. Scale bars: 100 µm (A,F); 500 µm (B); 75 µm (C,D). |