
FIGURE
Fig. 2
- ID
- ZDB-FIG-250331-14
- Publication
- Tanwar et al., 2024 - Dynamic gene expression pattern in zebrafish gall bladder - an experimental study
- Other Figures
- All Figure Page
- Back to All Figure Page
Fig. 2
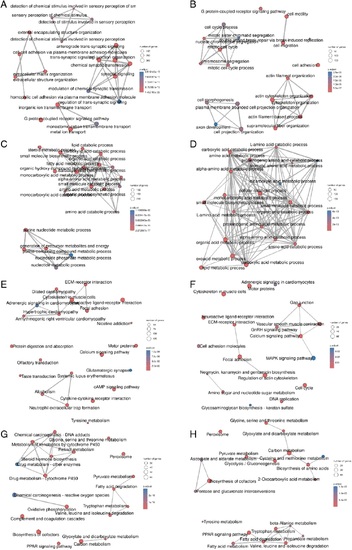
Gene ontology (GO) enrichment analysis of biological processes and KEGG pathway enrichment analysis (A) and (B) are enrichment of upregulated genes. (C) and (D) are enrichment of downregulated genes. (A) and (C) are human GO enrichment. (B) and (D) are Zebrafish GO enrichment. (E) and (F) are enrichment of upregulated genes. (G) and (H) are enrichment of downregulated genes. (E) and (G) are HUMAN KEGG enrichment. (F) and (H) are zebrafish KEGG enrichment. |
Expression Data
Expression Detail
Antibody Labeling
Phenotype Data
Phenotype Detail
Acknowledgments
This image is the copyrighted work of the attributed author or publisher, and
ZFIN has permission only to display this image to its users.
Additional permissions should be obtained from the applicable author or publisher of the image.
Full text @ Int J Surg