|
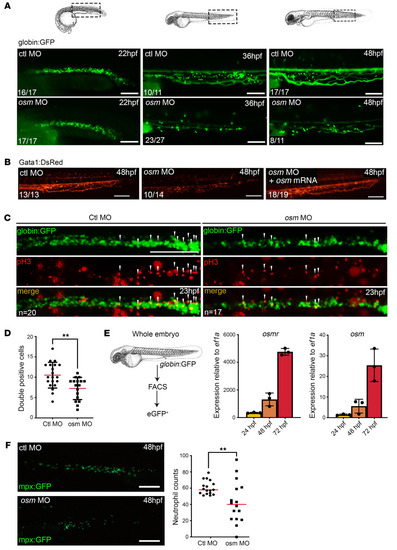
Osm-morphants show erythropoiesis defect. (A) globin:GFP embryos were injected with control- or osm- morpholino (MO), and observed by fluorescence microscopy to measure their content in erythrocytes. Dashed rectangles highlight the part of zebrafish in which the cells are detected. Numbers in bottom left of images indicate the number of embryos displaying the indicated phenotype out of the total number of embryos analyzed. Scale bars: 100 μm. (B) The strong reduction of circulating erythrocytes (detected by gata1:DsRed marker) in osm-MO is rescued by overexpressing osm (noted + osm mRNA). Numbers in bottom left of images indicate the number of embryos displaying the indicated phenotype out of the total number of embryos analyzed. Scale bars: 200 μm. (C) 23 hpf globin:GFP embryos were stained for phospho-histone 3 (pH3), a marker of proliferation. Arrows indicate colocalization of pH3 and globin:GFP. Scale bar: 100 μm. (D) Fewer globin:GFP/pH3 double-positive cells are detected in osm-morphants, demonstrating a decrease in proliferating erythroid progenitors. Statistics derived from unpaired t tests with α = 0.05. **P < 0.01. (E) Quantitative PCR performed on sorted erythrocytes (GFP+ cells) at different stages show that they express high levels of osmr and osm transcripts. (F) Left: mpx:GFP embryos were injected with control- or osm- morpholino (MO) and observed by fluorescence microscopy to measure their content in neutrophils. Right: Fewer mpx:GFP cells are detected in osm-morphants, demonstrating a decrease in neutrophils. Statistics derived from unpaired t tests with α = 0.05. **P < 0.01.
|