|
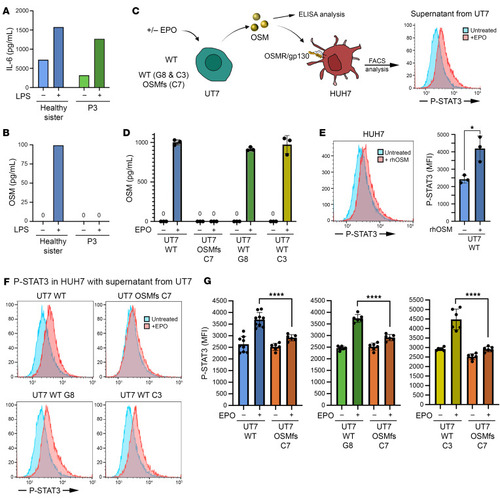
Functional consequence of the OSM mutation. (A) IL-6 concentration measured by ELISA in supernatants from LPS-activated monocytes from the healthy sister and P3. (B) OSM concentration measured by ELISA in supernatants from LPS-activated monocytes from the healthy sister and P3. (C) Schematic representation of the protocol used to measure OSM production by ELISA in supernatant from EPO-activated UT7 cells and its signaling detection in HUH7. OSM induces STAT3 phosphorylation (pSTAT3) in HUH7 as detected by FACS. (D) OSM concentration measured by ELISA in supernatants from EPO-activated WT UT7 cell line, the UT7 clone carrying the frameshift in the OSM sequence (clone C7), and 2 WT UT7 clones (C3 and G8). (E) Left: Representative FACS result demonstrating that rhOSM, used as positive control, induced a shift in STAT3 phosphorylation signal in HUH7 cells. Right: Quantitative analysis of 3 independent replicates. Statistics derived from unpaired t tests with α = 0.05. *P < 0.05. (F) Representative FACS results of p-STAT3 detection in HUH7 cells in the presence of indicated supernatants. (G) p-STAT3 induction obtained with the supernatants from EPO-activated WT UT7 cell line, the UT7 clone carrying the frameshift in the OSM sequence (clone C7), and 2 WT UT7 clones (C3 and G8). Quantitative analysis of 3 independent replicates. Statistics derived from unpaired t tests with α = 0.05. ****P < 0.0001.
|