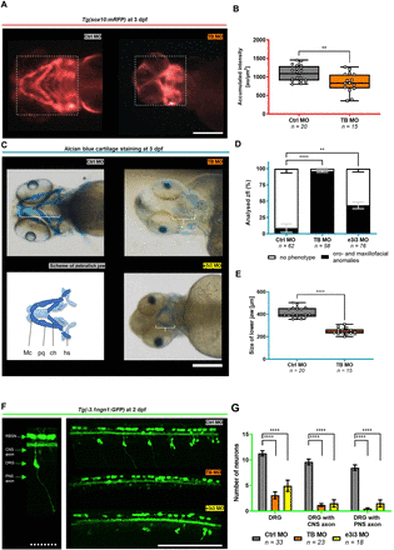
Tfap2e KD is implicated in the disruption of neural crest-specific tissues. (A–B) Representative in vivo fluorescence imaging of the jaw of Tg(sox10:mRFP) zfl at 3 days post fertilisation (dpf) on Tfap2e KD and box plot graph of sox10:mRFP reporter-signal intensity. The dotted rectangle indicates the area that was chosen to measure the accumulated fluorescence intensity in arbitrary units (au)/µm2. Morphants present with a pathological formation and a reduced Sox10 signal at 3 dpf after Tfap2e KD, indicating neural crest cell disruption. (C–E) Representative Alcian blue cartilage staining of zfl at 3 dpf and simplified schematic of the developing zebrafish craniofacies (C), column graph of the percentage of zfl with orofacial and maxillofacial anomalies (D), and box plot graph of measured sizes of the lower jaw on Tfap2e KD (E). White brackets in (C) indicate the measured distance from the rostral end of the Meckel’s cartilage to the caudal point of the hyosympletic cartilage. On Tfap2e KD, we observed a reduced jaw size according to hypoplasia of relevant orofacial and maxillofacial structures including the Meckel’s cartilage (Mc), ceratohyal (ch), palatoquadrate (pq) and hyosympletic (hs). (F–G) Representative in vivo 2-photon microscopy of the spinal cord of Tg(−3.1ngn1:GFP) zfl on Tfap2e KD at 2 dpf and column graph of counted fluorescent neurons and their axons. The left panel is a close-up view and description of the analysed cell types. Note the strongly reduced number of DRG neurons in both morpholino (MO) KD groups. Additionally, central and peripheral axonal outgrowth of the remaining DRG neurons is impaired. **p<0.01, ****p<0.0001 (B, E: unpaired t-test; D: one-way ANOVA with Tukey’s multiple comparison; G: two-way ANOVA with Tukey’s multiple comparison). Number of independent experiments n=3 for all graphs, number of investigated zfl n as indicated. White scale bars: 200 µm. White dotted scale bar: 50 µm. ANOVA, analysis of variance; CNS, central nervous system; DRG, dorsal root ganglia; KD, knockdown; TB, translation blocking; zfl, zebrafish larvae.
|
